Korean vs Somali 12th Grade, No Diploma

COMPARE

Korean
Race
Ancestry
AfghanAfricanAlaska NativeAlaskan AthabascanAlbanianAleutAlsatianAmericanApacheArabArapahoArgentineanArmenianAssyrian/Chaldean/SyriacAustralianAustrianBahamianBangladeshiBarbadianBasqueBelgianBelizeanBermudanBhutaneseBlackfeetBolivianBrazilianBritishBritish West IndianBulgarianBurmeseCajunCambodianCanadianCape VerdeanCarpatho RusynCelticCentral AmericanCentral American IndianCherokeeCheyenneChickasawChileanChineseChippewaChoctawColombianColvilleComancheCosta RicanCreeCreekCroatianCrowCubanCypriotCzechCzechoslovakianDanishDelawareDominicanDutchDutch West IndianEastern EuropeanEcuadorianEgyptianEnglishEstonianEthiopianEuropeanFijianFilipinoFinnishFrenchFrench American IndianFrench CanadianGermanGerman RussianGhanaianGreekGuamanian/ChamorroGuatemalanGuyaneseHaitianHmongHonduranHopiHoumaHungarianIcelanderIndian (Asian)IndonesianInupiatIranianIraqiIrishIroquoisIsraeliItalianJamaicanJapaneseJordanianKenyanKiowaKoreanLaotianLatvianLebaneseLiberianLithuanianLumbeeLuxembourgerMacedonianMalaysianMalteseMarshalleseMenomineeMexicanMexican American IndianMongolianMoroccanNative HawaiianNavajoNepaleseNew ZealanderNicaraguanNigerianNorthern EuropeanNorwegianOkinawanOsageOttawaPaiutePakistaniPalestinianPanamanianParaguayanPennsylvania GermanPeruvianPimaPolishPortuguesePotawatomiPuebloPuerto RicanPuget Sound SalishRomanianRussianSalvadoranSamoanScandinavianScotch-IrishScottishSeminoleSenegaleseSerbianShoshoneSierra LeoneanSiouxSlavicSlovakSloveneSouth AfricanSouth AmericanSouth American IndianSoviet UnionSpaniardSpanishSpanish AmericanSpanish American IndianSri LankanSubsaharan AfricanSudaneseSwedishSwissSyrianTaiwaneseThaiTlingit-HaidaTohono O'OdhamTonganTrinidadian and TobagonianTsimshianTurkishU.S. Virgin IslanderUgandanUkrainianUruguayanUteVenezuelanVietnameseWelshWest IndianYakamaYaquiYugoslavianYumanYup'ikZimbabwean
Immigration
NonimmigrantsImmigrantsAfghanistanAfricaAlbaniaArgentinaArmeniaAsiaAustraliaAustriaBahamasBangladeshBarbadosBelarusBelgiumBelizeBoliviaBosnia and HerzegovinaBrazilBulgariaBurma/MyanmarCabo VerdeCambodiaCameroonCanadaCaribbeanCentral AmericaChileChinaColombiaCongoCosta RicaCroatiaCubaCzechoslovakiaDenmarkDominicaDominican RepublicEastern AfricaEastern AsiaEastern EuropeEcuadorEgyptEl SalvadorEnglandEritreaEthiopiaEuropeFijiFranceGermanyGhanaGreeceGrenadaGuatemalaGuyanaHaitiHondurasHong KongHungaryIndiaIndonesiaIranIraqIrelandIsraelItalyJamaicaJapanJordanKazakhstanKenyaKoreaKuwaitLaosLatin AmericaLatviaLebanonLiberiaLithuaniaMalaysiaMexicoMicronesiaMiddle AfricaMoldovaMoroccoNepalNetherlandsNicaraguaNigeriaNorth AmericaNorth MacedoniaNorthern AfricaNorthern EuropeNorwayOceaniaPakistanPanamaPeruPhilippinesPolandPortugalRomaniaRussiaSaudi ArabiaScotlandSenegalSerbiaSierra LeoneSingaporeSomaliaSouth AfricaSouth AmericaSouth Central AsiaSouth Eastern AsiaSouthern EuropeSpainSri LankaSt. Vincent and the GrenadinesSudanSwedenSwitzerlandSyriaTaiwanThailandTrinidad and TobagoTurkeyUgandaUkraineUruguayUzbekistanVenezuelaVietnamWest IndiesWestern AfricaWestern AsiaWestern EuropeYemenZaireZimbabweAzores
Somali
Race
Ancestry
AfghanAfricanAlaska NativeAlaskan AthabascanAlbanianAleutAlsatianAmericanApacheArabArapahoArgentineanArmenianAssyrian/Chaldean/SyriacAustralianAustrianBahamianBangladeshiBarbadianBasqueBelgianBelizeanBermudanBhutaneseBlackfeetBolivianBrazilianBritishBritish West IndianBulgarianBurmeseCajunCambodianCanadianCape VerdeanCarpatho RusynCelticCentral AmericanCentral American IndianCherokeeCheyenneChickasawChileanChineseChippewaChoctawColombianColvilleComancheCosta RicanCreeCreekCroatianCrowCubanCypriotCzechCzechoslovakianDanishDelawareDominicanDutchDutch West IndianEastern EuropeanEcuadorianEgyptianEnglishEstonianEthiopianEuropeanFijianFilipinoFinnishFrenchFrench American IndianFrench CanadianGermanGerman RussianGhanaianGreekGuamanian/ChamorroGuatemalanGuyaneseHaitianHmongHonduranHopiHoumaHungarianIcelanderIndian (Asian)IndonesianInupiatIranianIraqiIrishIroquoisIsraeliItalianJamaicanJapaneseJordanianKenyanKiowaLaotianLatvianLebaneseLiberianLithuanianLumbeeLuxembourgerMacedonianMalaysianMalteseMarshalleseMenomineeMexicanMexican American IndianMongolianMoroccanNative HawaiianNavajoNepaleseNew ZealanderNicaraguanNigerianNorthern EuropeanNorwegianOkinawanOsageOttawaPaiutePakistaniPalestinianPanamanianParaguayanPennsylvania GermanPeruvianPimaPolishPortuguesePotawatomiPuebloPuerto RicanPuget Sound SalishRomanianRussianSalvadoranSamoanScandinavianScotch-IrishScottishSeminoleSenegaleseSerbianShoshoneSierra LeoneanSiouxSlavicSlovakSloveneSomaliSouth AfricanSouth AmericanSouth American IndianSoviet UnionSpaniardSpanishSpanish AmericanSpanish American IndianSri LankanSubsaharan AfricanSudaneseSwedishSwissSyrianTaiwaneseThaiTlingit-HaidaTohono O'OdhamTonganTrinidadian and TobagonianTsimshianTurkishU.S. Virgin IslanderUgandanUkrainianUruguayanUteVenezuelanVietnameseWelshWest IndianYakamaYaquiYugoslavianYumanYup'ikZimbabwean
Immigration
NonimmigrantsImmigrantsAfghanistanAfricaAlbaniaArgentinaArmeniaAsiaAustraliaAustriaBahamasBangladeshBarbadosBelarusBelgiumBelizeBoliviaBosnia and HerzegovinaBrazilBulgariaBurma/MyanmarCabo VerdeCambodiaCameroonCanadaCaribbeanCentral AmericaChileChinaColombiaCongoCosta RicaCroatiaCubaCzechoslovakiaDenmarkDominicaDominican RepublicEastern AfricaEastern AsiaEastern EuropeEcuadorEgyptEl SalvadorEnglandEritreaEthiopiaEuropeFijiFranceGermanyGhanaGreeceGrenadaGuatemalaGuyanaHaitiHondurasHong KongHungaryIndiaIndonesiaIranIraqIrelandIsraelItalyJamaicaJapanJordanKazakhstanKenyaKoreaKuwaitLaosLatin AmericaLatviaLebanonLiberiaLithuaniaMalaysiaMexicoMicronesiaMiddle AfricaMoldovaMoroccoNepalNetherlandsNicaraguaNigeriaNorth AmericaNorth MacedoniaNorthern AfricaNorthern EuropeNorwayOceaniaPakistanPanamaPeruPhilippinesPolandPortugalRomaniaRussiaSaudi ArabiaScotlandSenegalSerbiaSierra LeoneSingaporeSomaliaSouth AfricaSouth AmericaSouth Central AsiaSouth Eastern AsiaSouthern EuropeSpainSri LankaSt. Vincent and the GrenadinesSudanSwedenSwitzerlandSyriaTaiwanThailandTrinidad and TobagoTurkeyUgandaUkraineUruguayUzbekistanVenezuelaVietnamWest IndiesWestern AfricaWestern AsiaWestern EuropeYemenZaireZimbabweAzores
12th Grade, No Diploma
Income
Poverty
Unemployment
Labor Participation
Family Structure
Vehicle Availability
Education Level
Disability

12th Grade, No Diploma Comparison

Koreans

Somalis

Fair
Poor
90.8%
12TH GRADE, NO DIPLOMA
24.5/ 100
METRIC RATING
195th/ 347
METRIC RANK
90.6%
12TH GRADE, NO DIPLOMA
10.2/ 100
METRIC RATING
212th/ 347
METRIC RANK

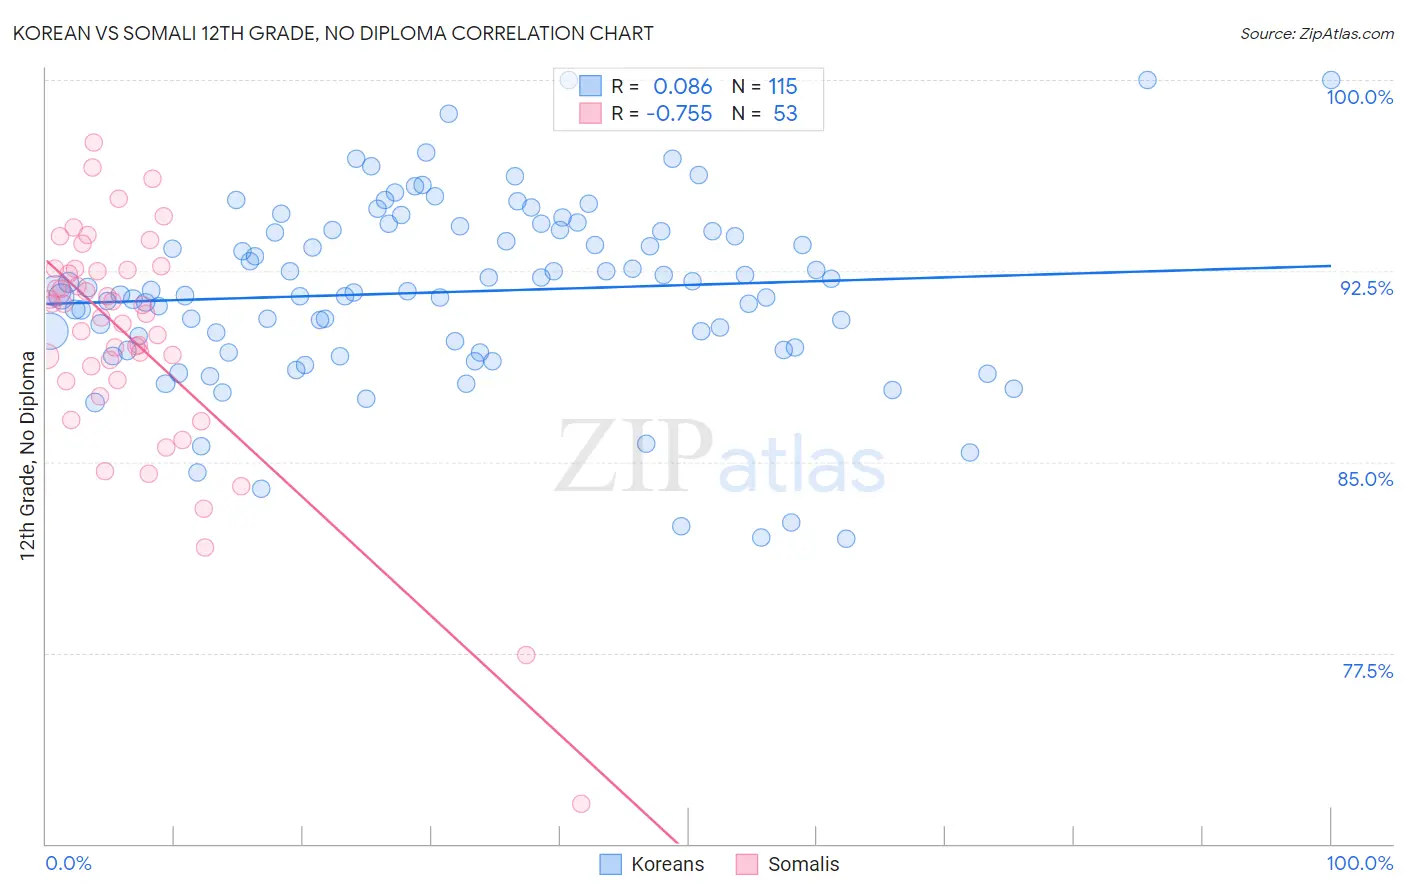
Korean vs Somali 12th Grade, No Diploma Correlation Chart

The statistical analysis conducted on geographies consisting of 510,943,943 people shows a slight positive correlation between the proportion of Koreans and percentage of population with at least 12th grade (no diploma) education in the United States with a correlation coefficient (R) of 0.086 and weighted average of 90.8%. Similarly, the statistical analysis conducted on geographies consisting of 99,330,527 people shows a strong negative correlation between the proportion of Somalis and percentage of population with at least 12th grade (no diploma) education in the United States with a correlation coefficient (R) of -0.755 and weighted average of 90.6%, a difference of 0.32%.
Korean vs Somali 12th Grade, No Diploma

12th Grade, No Diploma Correlation Summary

MeasurementKoreanSomali
Minimum82.0%71.6%
Maximum100.0%97.6%
Range18.0%26.0%
Mean91.7%89.8%
Median91.7%90.8%
Interquartile 25% (IQ1)89.4%88.2%
Interquartile 75% (IQ3)94.1%92.5%
Interquartile Range (IQR)4.7%4.3%
Standard Deviation (Sample)3.6%4.6%
Standard Deviation (Population)3.6%4.6%

Demographics Similar to Koreans and Somalis by 12th Grade, No Diploma

In terms of 12th grade, no diploma, the demographic groups most similar to Koreans are Immigrants from Oceania (90.9%, a difference of 0.030%), Panamanian (90.8%, a difference of 0.030%), Immigrants from Sudan (90.8%, a difference of 0.030%), Immigrants from Ethiopia (90.9%, a difference of 0.040%), and Samoan (90.8%, a difference of 0.070%). Similarly, the demographic groups most similar to Somalis are Portuguese (90.6%, a difference of 0.010%), Immigrants from Afghanistan (90.6%, a difference of 0.020%), South American Indian (90.6%, a difference of 0.020%), Immigrants from Micronesia (90.6%, a difference of 0.030%), and Costa Rican (90.5%, a difference of 0.030%).
DemographicsRating | Rank12th Grade, No Diploma
Immigrants | Ethiopia
27.2
/100
|
#193
Fair
90.9%
Immigrants | Oceania
26.0
/100
|
#194
Fair
90.9%
Koreans
24.5
/100
|
#195
Fair
90.8%
Panamanians
22.8
/100
|
#196
Fair
90.8%
Immigrants | Sudan
22.6
/100
|
#197
Fair
90.8%
Samoans
20.4
/100
|
#198
Fair
90.8%
Immigrants | Southern Europe
19.9
/100
|
#199
Poor
90.8%
Liberians
19.8
/100
|
#200
Poor
90.8%
Hawaiians
19.7
/100
|
#201
Poor
90.8%
Marshallese
18.2
/100
|
#202
Poor
90.7%
Tongans
16.1
/100
|
#203
Poor
90.7%
French American Indians
15.5
/100
|
#204
Poor
90.7%
Immigrants | Sierra Leone
14.9
/100
|
#205
Poor
90.7%
Immigrants | Bolivia
12.3
/100
|
#206
Poor
90.6%
Armenians
11.6
/100
|
#207
Poor
90.6%
Immigrants | Micronesia
11.0
/100
|
#208
Poor
90.6%
Immigrants | Afghanistan
11.0
/100
|
#209
Poor
90.6%
South American Indians
10.9
/100
|
#210
Poor
90.6%
Portuguese
10.6
/100
|
#211
Poor
90.6%
Somalis
10.2
/100
|
#212
Poor
90.6%
Costa Ricans
9.4
/100
|
#213
Tragic
90.5%