Iranian vs Immigrants from Czechoslovakia 9th Grade
COMPARE
Iranian
Immigrants from Czechoslovakia
9th Grade
9th Grade Comparison
Iranians
Immigrants from Czechoslovakia
96.1%
9TH GRADE
99.9/ 100
METRIC RATING
43rd/ 347
METRIC RANK
95.7%
9TH GRADE
98.9/ 100
METRIC RATING
88th/ 347
METRIC RANK
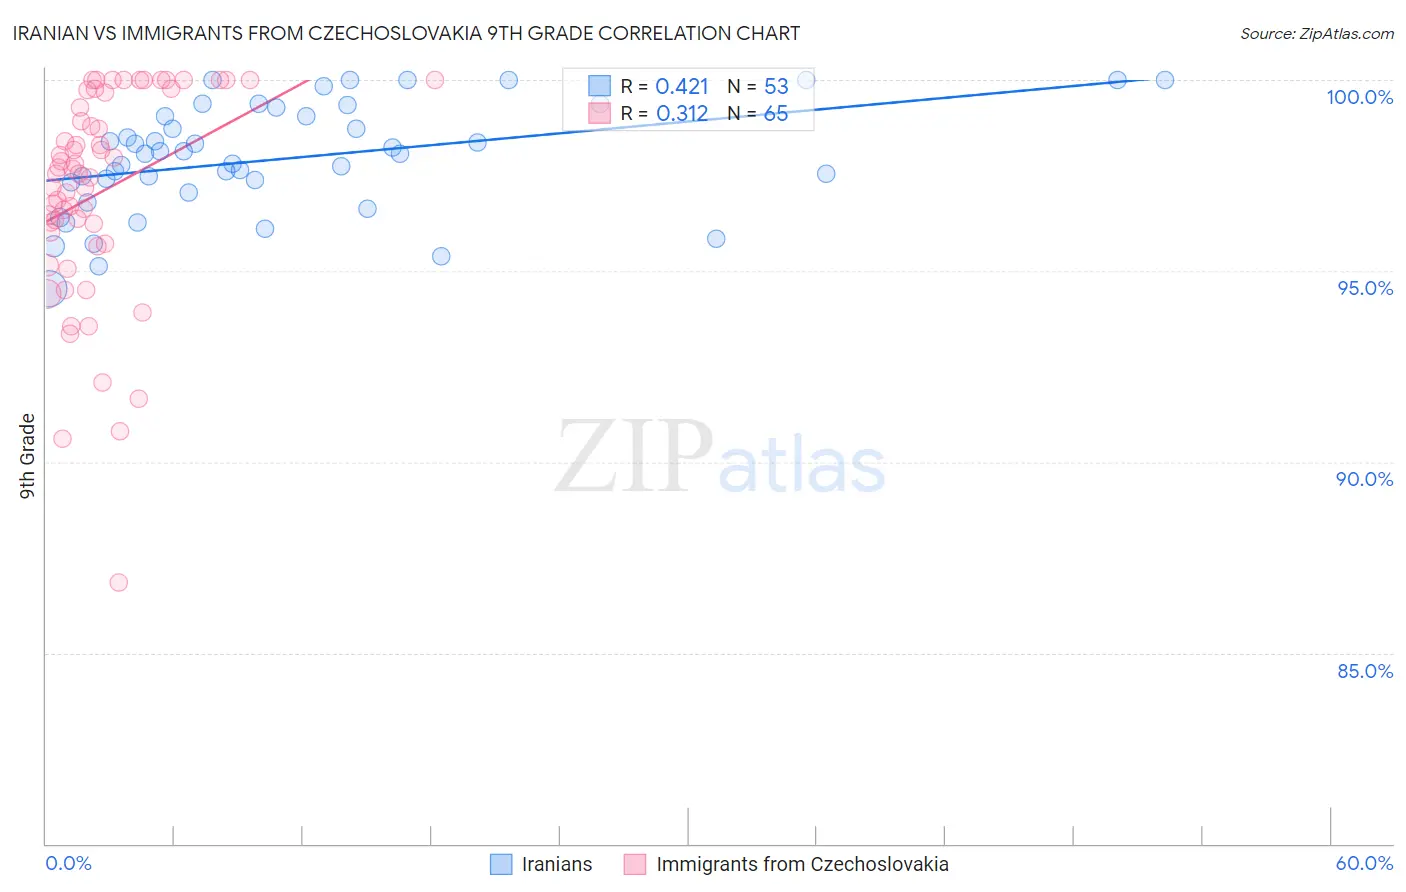
Iranian vs Immigrants from Czechoslovakia 9th Grade Correlation Chart
The statistical analysis conducted on geographies consisting of 310,636,461 people shows a moderate positive correlation between the proportion of Iranians and percentage of population with at least 9th grade education in the United States with a correlation coefficient (R) of 0.421 and weighted average of 96.1%. Similarly, the statistical analysis conducted on geographies consisting of 195,448,106 people shows a mild positive correlation between the proportion of Immigrants from Czechoslovakia and percentage of population with at least 9th grade education in the United States with a correlation coefficient (R) of 0.312 and weighted average of 95.7%, a difference of 0.45%.
9th Grade Correlation Summary
| Measurement | Iranian | Immigrants from Czechoslovakia |
| Minimum | 94.5% | 86.9% |
| Maximum | 100.0% | 100.0% |
| Range | 5.5% | 13.1% |
| Mean | 98.0% | 97.1% |
| Median | 98.1% | 97.5% |
| Interquartile 25% (IQ1) | 97.2% | 95.9% |
| Interquartile 75% (IQ3) | 99.2% | 99.7% |
| Interquartile Range (IQR) | 2.0% | 3.8% |
| Standard Deviation (Sample) | 1.4% | 2.8% |
| Standard Deviation (Population) | 1.4% | 2.7% |
Similar Demographics by 9th Grade
Demographics Similar to Iranians by 9th Grade
In terms of 9th grade, the demographic groups most similar to Iranians are Czechoslovakian (96.1%, a difference of 0.010%), Chippewa (96.1%, a difference of 0.010%), Slavic (96.1%, a difference of 0.020%), Alaska Native (96.1%, a difference of 0.020%), and Crow (96.1%, a difference of 0.030%).
| Demographics | Rating | Rank | 9th Grade |
| Northern Europeans | 99.9 /100 | #36 | Exceptional 96.2% |
| Estonians | 99.9 /100 | #37 | Exceptional 96.1% |
| Immigrants | Scotland | 99.9 /100 | #38 | Exceptional 96.1% |
| Ottawa | 99.9 /100 | #39 | Exceptional 96.1% |
| Slavs | 99.9 /100 | #40 | Exceptional 96.1% |
| Czechoslovakians | 99.9 /100 | #41 | Exceptional 96.1% |
| Chippewa | 99.9 /100 | #42 | Exceptional 96.1% |
| Iranians | 99.9 /100 | #43 | Exceptional 96.1% |
| Alaska Natives | 99.9 /100 | #44 | Exceptional 96.1% |
| Crow | 99.9 /100 | #45 | Exceptional 96.1% |
| Immigrants | India | 99.9 /100 | #46 | Exceptional 96.1% |
| Russians | 99.9 /100 | #47 | Exceptional 96.0% |
| Australians | 99.9 /100 | #48 | Exceptional 96.0% |
| Greeks | 99.9 /100 | #49 | Exceptional 96.0% |
| Celtics | 99.9 /100 | #50 | Exceptional 96.0% |
Demographics Similar to Immigrants from Czechoslovakia by 9th Grade
In terms of 9th grade, the demographic groups most similar to Immigrants from Czechoslovakia are Yugoslavian (95.7%, a difference of 0.0%), Okinawan (95.7%, a difference of 0.010%), South African (95.6%, a difference of 0.010%), Creek (95.6%, a difference of 0.020%), and Immigrants from Saudi Arabia (95.6%, a difference of 0.020%).
| Demographics | Rating | Rank | 9th Grade |
| Arapaho | 99.3 /100 | #81 | Exceptional 95.7% |
| Puget Sound Salish | 99.2 /100 | #82 | Exceptional 95.7% |
| Swiss | 99.2 /100 | #83 | Exceptional 95.7% |
| Immigrants | Denmark | 99.1 /100 | #84 | Exceptional 95.7% |
| Icelanders | 99.1 /100 | #85 | Exceptional 95.7% |
| Immigrants | Western Europe | 99.1 /100 | #86 | Exceptional 95.7% |
| Okinawans | 99.0 /100 | #87 | Exceptional 95.7% |
| Immigrants | Czechoslovakia | 98.9 /100 | #88 | Exceptional 95.7% |
| Yugoslavians | 98.9 /100 | #89 | Exceptional 95.7% |
| South Africans | 98.8 /100 | #90 | Exceptional 95.6% |
| Creek | 98.8 /100 | #91 | Exceptional 95.6% |
| Immigrants | Saudi Arabia | 98.8 /100 | #92 | Exceptional 95.6% |
| Immigrants | Germany | 98.7 /100 | #93 | Exceptional 95.6% |
| Immigrants | Latvia | 98.7 /100 | #94 | Exceptional 95.6% |
| Americans | 98.5 /100 | #95 | Exceptional 95.6% |