Immigrants from Yemen vs Hopi 7th Grade
COMPARE
Immigrants from Yemen
Hopi
7th Grade
7th Grade Comparison
Immigrants from Yemen
Hopi
92.6%
7TH GRADE
0.0/ 100
METRIC RATING
334th/ 347
METRIC RANK
96.3%
7TH GRADE
81.6/ 100
METRIC RATING
151st/ 347
METRIC RANK
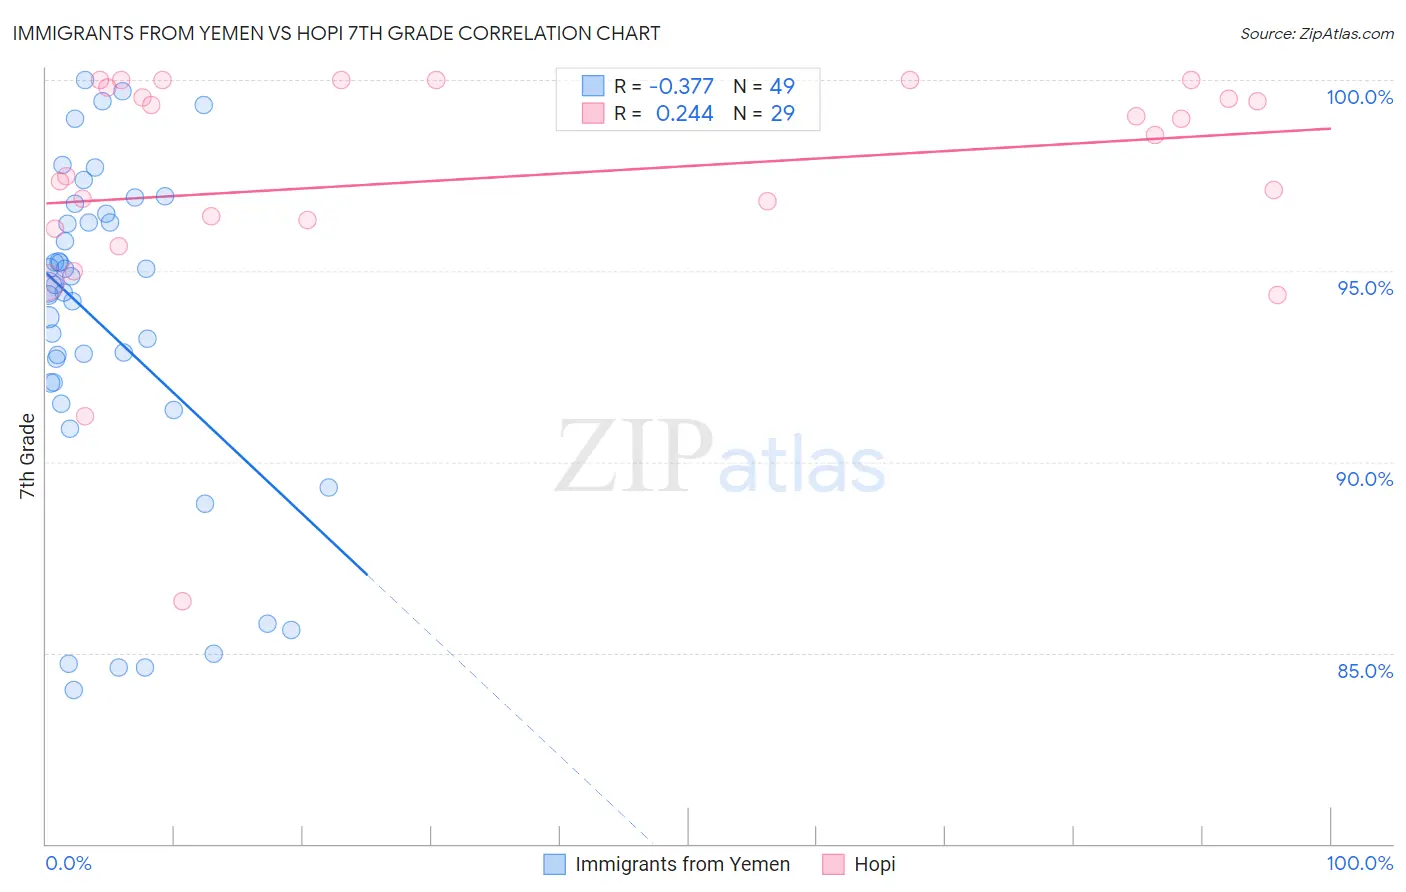
Immigrants from Yemen vs Hopi 7th Grade Correlation Chart
The statistical analysis conducted on geographies consisting of 82,429,885 people shows a mild negative correlation between the proportion of Immigrants from Yemen and percentage of population with at least 7th grade education in the United States with a correlation coefficient (R) of -0.377 and weighted average of 92.6%. Similarly, the statistical analysis conducted on geographies consisting of 74,739,957 people shows a weak positive correlation between the proportion of Hopi and percentage of population with at least 7th grade education in the United States with a correlation coefficient (R) of 0.244 and weighted average of 96.3%, a difference of 3.9%.
7th Grade Correlation Summary
| Measurement | Immigrants from Yemen | Hopi |
| Minimum | 84.0% | 86.4% |
| Maximum | 100.0% | 100.0% |
| Range | 16.0% | 13.6% |
| Mean | 93.5% | 97.4% |
| Median | 94.6% | 98.6% |
| Interquartile 25% (IQ1) | 91.8% | 96.2% |
| Interquartile 75% (IQ3) | 96.4% | 99.9% |
| Interquartile Range (IQR) | 4.6% | 3.7% |
| Standard Deviation (Sample) | 4.3% | 3.1% |
| Standard Deviation (Population) | 4.3% | 3.0% |
Similar Demographics by 7th Grade
Demographics Similar to Immigrants from Yemen by 7th Grade
In terms of 7th grade, the demographic groups most similar to Immigrants from Yemen are Immigrants from Armenia (92.7%, a difference of 0.080%), Hispanic or Latino (92.7%, a difference of 0.10%), Mexican American Indian (92.6%, a difference of 0.10%), Immigrants from Honduras (92.5%, a difference of 0.17%), and Honduran (92.9%, a difference of 0.24%).
| Demographics | Rating | Rank | 7th Grade |
| Immigrants | Cabo Verde | 0.0 /100 | #327 | Tragic 93.1% |
| Immigrants | Nicaragua | 0.0 /100 | #328 | Tragic 93.0% |
| Immigrants | Azores | 0.0 /100 | #329 | Tragic 93.0% |
| Immigrants | Dominican Republic | 0.0 /100 | #330 | Tragic 92.9% |
| Hondurans | 0.0 /100 | #331 | Tragic 92.9% |
| Hispanics or Latinos | 0.0 /100 | #332 | Tragic 92.7% |
| Immigrants | Armenia | 0.0 /100 | #333 | Tragic 92.7% |
| Immigrants | Yemen | 0.0 /100 | #334 | Tragic 92.6% |
| Mexican American Indians | 0.0 /100 | #335 | Tragic 92.6% |
| Immigrants | Honduras | 0.0 /100 | #336 | Tragic 92.5% |
| Immigrants | Latin America | 0.0 /100 | #337 | Tragic 92.2% |
| Central Americans | 0.0 /100 | #338 | Tragic 92.1% |
| Mexicans | 0.0 /100 | #339 | Tragic 91.9% |
| Yakama | 0.0 /100 | #340 | Tragic 91.7% |
| Guatemalans | 0.0 /100 | #341 | Tragic 91.7% |
Demographics Similar to Hopi by 7th Grade
In terms of 7th grade, the demographic groups most similar to Hopi are Israeli (96.3%, a difference of 0.010%), Albanian (96.3%, a difference of 0.010%), Immigrants from Belarus (96.3%, a difference of 0.010%), Immigrants from Eastern Europe (96.3%, a difference of 0.020%), and French American Indian (96.3%, a difference of 0.020%).
| Demographics | Rating | Rank | 7th Grade |
| Immigrants | Greece | 85.9 /100 | #144 | Excellent 96.3% |
| Blackfeet | 83.9 /100 | #145 | Excellent 96.3% |
| Immigrants | Eastern Europe | 83.7 /100 | #146 | Excellent 96.3% |
| French American Indians | 83.1 /100 | #147 | Excellent 96.3% |
| Israelis | 82.8 /100 | #148 | Excellent 96.3% |
| Albanians | 82.6 /100 | #149 | Excellent 96.3% |
| Immigrants | Belarus | 82.4 /100 | #150 | Excellent 96.3% |
| Hopi | 81.6 /100 | #151 | Excellent 96.3% |
| Immigrants | Russia | 78.4 /100 | #152 | Good 96.2% |
| Seminole | 78.1 /100 | #153 | Good 96.2% |
| Immigrants | Israel | 77.6 /100 | #154 | Good 96.2% |
| Immigrants | Jordan | 77.0 /100 | #155 | Good 96.2% |
| Kenyans | 76.2 /100 | #156 | Good 96.2% |
| Ugandans | 75.5 /100 | #157 | Good 96.2% |
| Arabs | 68.6 /100 | #158 | Good 96.2% |