Scottish vs Immigrants from Korea High School Diploma
COMPARE
Scottish
Immigrants from Korea
High School Diploma
High School Diploma Comparison
Scottish
Immigrants from Korea
91.4%
HIGH SCHOOL DIPLOMA
99.9/ 100
METRIC RATING
34th/ 347
METRIC RANK
90.5%
HIGH SCHOOL DIPLOMA
98.3/ 100
METRIC RATING
98th/ 347
METRIC RANK
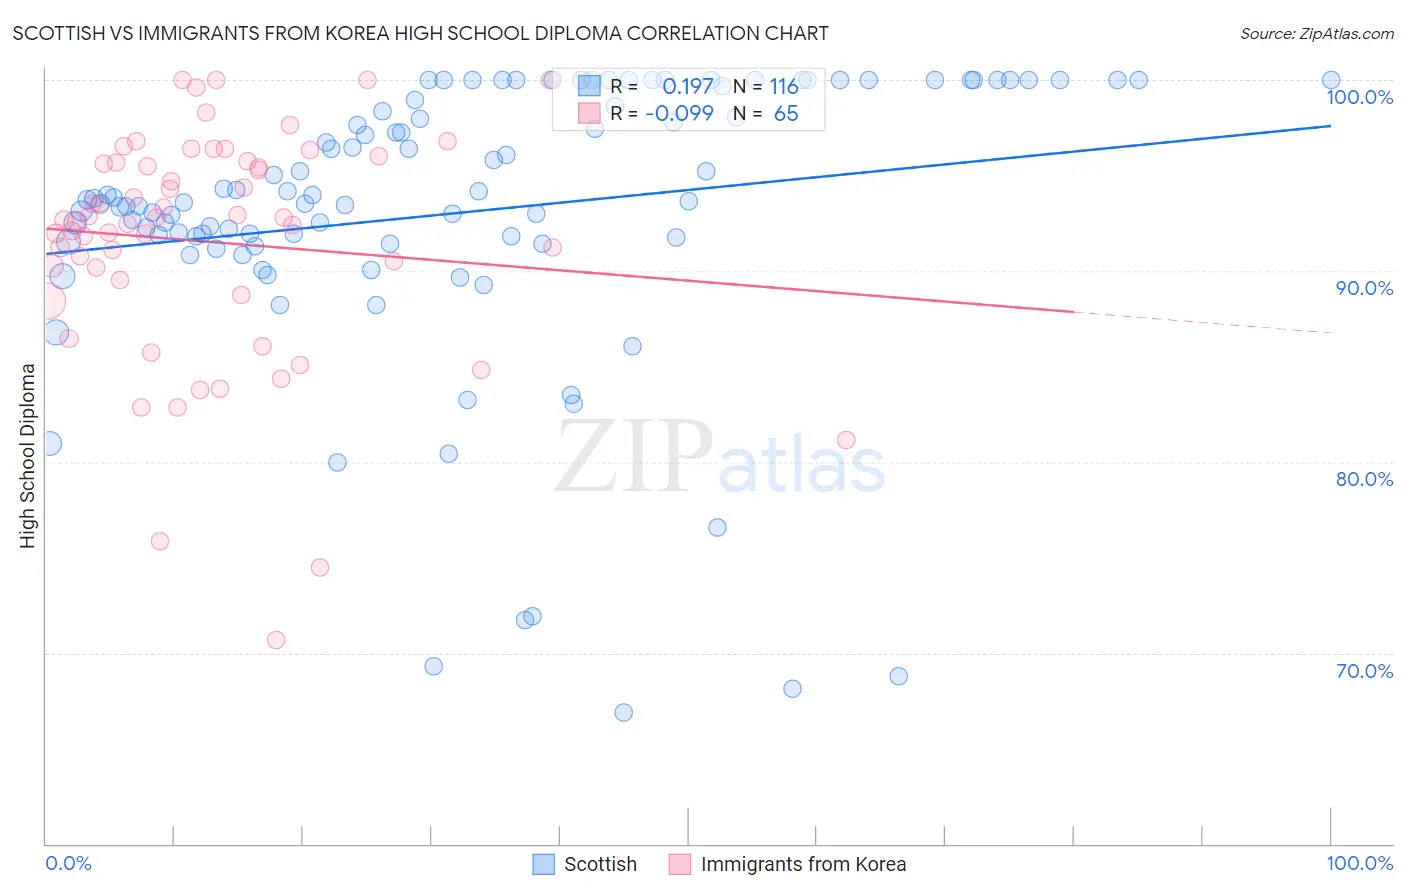
Scottish vs Immigrants from Korea High School Diploma Correlation Chart
The statistical analysis conducted on geographies consisting of 567,141,165 people shows a poor positive correlation between the proportion of Scottish and percentage of population with at least high school diploma education in the United States with a correlation coefficient (R) of 0.197 and weighted average of 91.4%. Similarly, the statistical analysis conducted on geographies consisting of 416,280,217 people shows a slight negative correlation between the proportion of Immigrants from Korea and percentage of population with at least high school diploma education in the United States with a correlation coefficient (R) of -0.099 and weighted average of 90.5%, a difference of 0.99%.
High School Diploma Correlation Summary
| Measurement | Scottish | Immigrants from Korea |
| Minimum | 66.9% | 70.6% |
| Maximum | 100.0% | 100.0% |
| Range | 33.1% | 29.4% |
| Mean | 93.0% | 91.5% |
| Median | 93.7% | 92.6% |
| Interquartile 25% (IQ1) | 91.5% | 89.1% |
| Interquartile 75% (IQ3) | 99.3% | 95.7% |
| Interquartile Range (IQR) | 7.8% | 6.6% |
| Standard Deviation (Sample) | 7.4% | 6.1% |
| Standard Deviation (Population) | 7.4% | 6.1% |
Similar Demographics by High School Diploma
Demographics Similar to Scottish by High School Diploma
In terms of high school diploma, the demographic groups most similar to Scottish are English (91.4%, a difference of 0.010%), Okinawan (91.4%, a difference of 0.010%), Iranian (91.4%, a difference of 0.020%), Immigrants from Northern Europe (91.4%, a difference of 0.020%), and European (91.4%, a difference of 0.030%).
| Demographics | Rating | Rank | High School Diploma |
| Cypriots | 99.9 /100 | #27 | Exceptional 91.5% |
| Tlingit-Haida | 99.9 /100 | #28 | Exceptional 91.4% |
| Europeans | 99.9 /100 | #29 | Exceptional 91.4% |
| Iranians | 99.9 /100 | #30 | Exceptional 91.4% |
| Immigrants | Northern Europe | 99.9 /100 | #31 | Exceptional 91.4% |
| English | 99.9 /100 | #32 | Exceptional 91.4% |
| Okinawans | 99.9 /100 | #33 | Exceptional 91.4% |
| Scottish | 99.9 /100 | #34 | Exceptional 91.4% |
| Irish | 99.9 /100 | #35 | Exceptional 91.4% |
| Tsimshian | 99.9 /100 | #36 | Exceptional 91.3% |
| Immigrants | Ireland | 99.9 /100 | #37 | Exceptional 91.3% |
| Immigrants | Scotland | 99.8 /100 | #38 | Exceptional 91.3% |
| Dutch | 99.8 /100 | #39 | Exceptional 91.3% |
| Immigrants | Lithuania | 99.8 /100 | #40 | Exceptional 91.3% |
| Immigrants | Australia | 99.8 /100 | #41 | Exceptional 91.3% |
Demographics Similar to Immigrants from Korea by High School Diploma
In terms of high school diploma, the demographic groups most similar to Immigrants from Korea are Immigrants from Kuwait (90.5%, a difference of 0.0%), Immigrants from Europe (90.5%, a difference of 0.020%), Immigrants from Serbia (90.5%, a difference of 0.030%), Immigrants from North Macedonia (90.5%, a difference of 0.030%), and Immigrants from Israel (90.5%, a difference of 0.040%).
| Demographics | Rating | Rank | High School Diploma |
| South Africans | 98.6 /100 | #91 | Exceptional 90.6% |
| Swiss | 98.6 /100 | #92 | Exceptional 90.6% |
| Immigrants | Western Europe | 98.6 /100 | #93 | Exceptional 90.6% |
| Immigrants | Israel | 98.5 /100 | #94 | Exceptional 90.5% |
| Icelanders | 98.5 /100 | #95 | Exceptional 90.5% |
| Immigrants | Serbia | 98.4 /100 | #96 | Exceptional 90.5% |
| Immigrants | Kuwait | 98.3 /100 | #97 | Exceptional 90.5% |
| Immigrants | Korea | 98.3 /100 | #98 | Exceptional 90.5% |
| Immigrants | Europe | 98.2 /100 | #99 | Exceptional 90.5% |
| Immigrants | North Macedonia | 98.1 /100 | #100 | Exceptional 90.5% |
| Immigrants | Norway | 98.0 /100 | #101 | Exceptional 90.5% |
| Aleuts | 98.0 /100 | #102 | Exceptional 90.4% |
| Immigrants | Romania | 97.8 /100 | #103 | Exceptional 90.4% |
| Immigrants | Croatia | 97.8 /100 | #104 | Exceptional 90.4% |
| Lebanese | 97.4 /100 | #105 | Exceptional 90.4% |