Scottish vs Immigrants from Burma/Myanmar High School Diploma
COMPARE
Scottish
Immigrants from Burma/Myanmar
High School Diploma
High School Diploma Comparison
Scottish
Immigrants from Burma/Myanmar
91.4%
HIGH SCHOOL DIPLOMA
99.9/ 100
METRIC RATING
34th/ 347
METRIC RANK
86.7%
HIGH SCHOOL DIPLOMA
0.1/ 100
METRIC RATING
276th/ 347
METRIC RANK
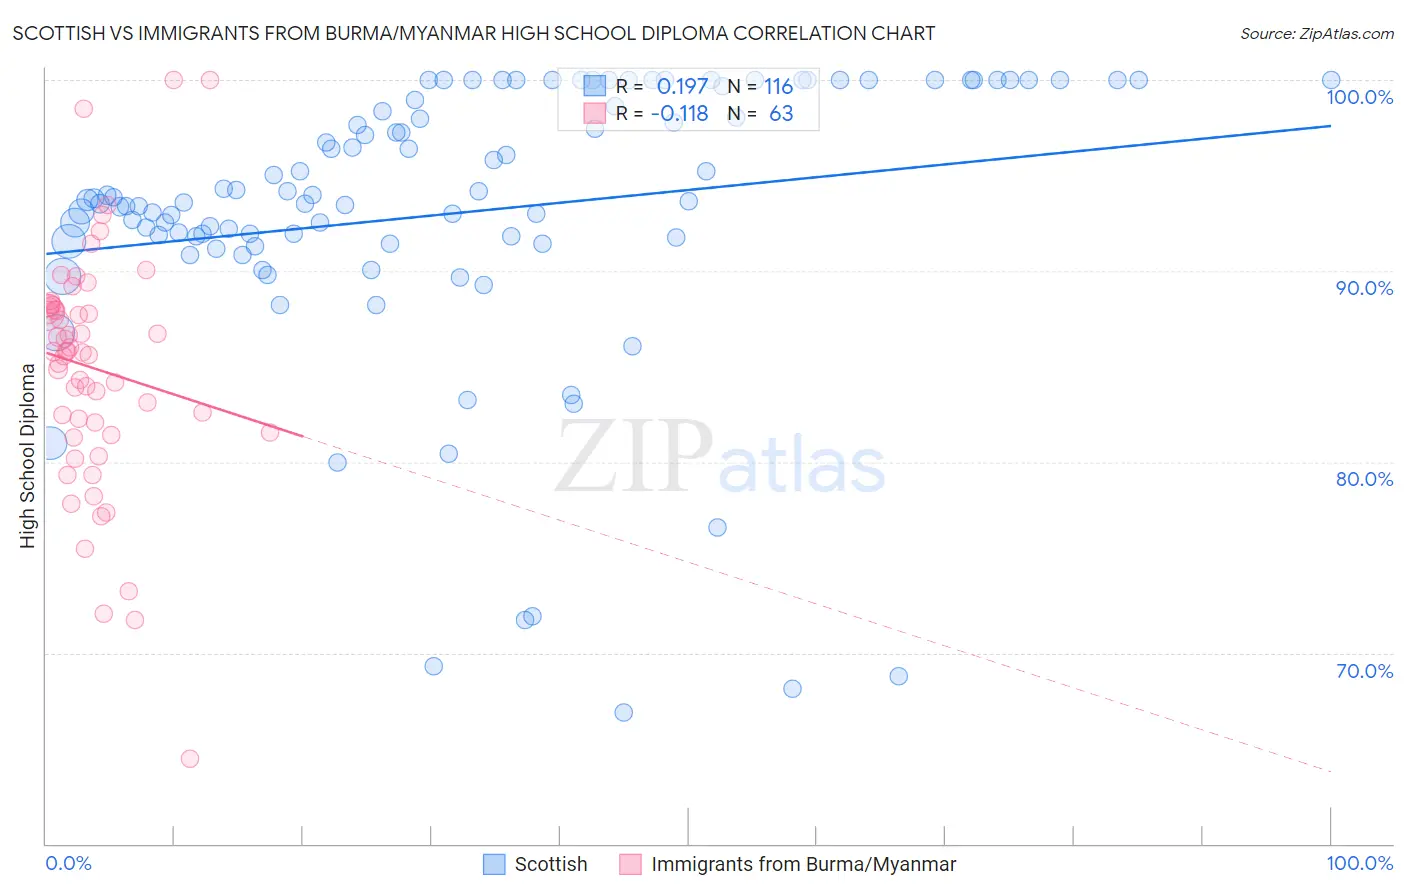
Scottish vs Immigrants from Burma/Myanmar High School Diploma Correlation Chart
The statistical analysis conducted on geographies consisting of 567,141,165 people shows a poor positive correlation between the proportion of Scottish and percentage of population with at least high school diploma education in the United States with a correlation coefficient (R) of 0.197 and weighted average of 91.4%. Similarly, the statistical analysis conducted on geographies consisting of 172,345,696 people shows a poor negative correlation between the proportion of Immigrants from Burma/Myanmar and percentage of population with at least high school diploma education in the United States with a correlation coefficient (R) of -0.118 and weighted average of 86.7%, a difference of 5.4%.
High School Diploma Correlation Summary
| Measurement | Scottish | Immigrants from Burma/Myanmar |
| Minimum | 66.9% | 64.5% |
| Maximum | 100.0% | 100.0% |
| Range | 33.1% | 35.5% |
| Mean | 93.0% | 84.9% |
| Median | 93.7% | 85.8% |
| Interquartile 25% (IQ1) | 91.5% | 81.5% |
| Interquartile 75% (IQ3) | 99.3% | 88.1% |
| Interquartile Range (IQR) | 7.8% | 6.6% |
| Standard Deviation (Sample) | 7.4% | 6.3% |
| Standard Deviation (Population) | 7.4% | 6.3% |
Similar Demographics by High School Diploma
Demographics Similar to Scottish by High School Diploma
In terms of high school diploma, the demographic groups most similar to Scottish are English (91.4%, a difference of 0.010%), Okinawan (91.4%, a difference of 0.010%), Iranian (91.4%, a difference of 0.020%), Immigrants from Northern Europe (91.4%, a difference of 0.020%), and European (91.4%, a difference of 0.030%).
| Demographics | Rating | Rank | High School Diploma |
| Cypriots | 99.9 /100 | #27 | Exceptional 91.5% |
| Tlingit-Haida | 99.9 /100 | #28 | Exceptional 91.4% |
| Europeans | 99.9 /100 | #29 | Exceptional 91.4% |
| Iranians | 99.9 /100 | #30 | Exceptional 91.4% |
| Immigrants | Northern Europe | 99.9 /100 | #31 | Exceptional 91.4% |
| English | 99.9 /100 | #32 | Exceptional 91.4% |
| Okinawans | 99.9 /100 | #33 | Exceptional 91.4% |
| Scottish | 99.9 /100 | #34 | Exceptional 91.4% |
| Irish | 99.9 /100 | #35 | Exceptional 91.4% |
| Tsimshian | 99.9 /100 | #36 | Exceptional 91.3% |
| Immigrants | Ireland | 99.9 /100 | #37 | Exceptional 91.3% |
| Immigrants | Scotland | 99.8 /100 | #38 | Exceptional 91.3% |
| Dutch | 99.8 /100 | #39 | Exceptional 91.3% |
| Immigrants | Lithuania | 99.8 /100 | #40 | Exceptional 91.3% |
| Immigrants | Australia | 99.8 /100 | #41 | Exceptional 91.3% |
Demographics Similar to Immigrants from Burma/Myanmar by High School Diploma
In terms of high school diploma, the demographic groups most similar to Immigrants from Burma/Myanmar are Barbadian (86.7%, a difference of 0.010%), Immigrants from Trinidad and Tobago (86.8%, a difference of 0.070%), Hopi (86.6%, a difference of 0.11%), Immigrants from Laos (86.6%, a difference of 0.16%), and Pueblo (86.5%, a difference of 0.18%).
| Demographics | Rating | Rank | High School Diploma |
| Sri Lankans | 0.2 /100 | #269 | Tragic 87.0% |
| Malaysians | 0.2 /100 | #270 | Tragic 87.0% |
| West Indians | 0.1 /100 | #271 | Tragic 86.9% |
| Trinidadians and Tobagonians | 0.1 /100 | #272 | Tragic 86.9% |
| Immigrants | Jamaica | 0.1 /100 | #273 | Tragic 86.9% |
| Bangladeshis | 0.1 /100 | #274 | Tragic 86.9% |
| Immigrants | Trinidad and Tobago | 0.1 /100 | #275 | Tragic 86.8% |
| Immigrants | Burma/Myanmar | 0.1 /100 | #276 | Tragic 86.7% |
| Barbadians | 0.1 /100 | #277 | Tragic 86.7% |
| Hopi | 0.1 /100 | #278 | Tragic 86.6% |
| Immigrants | Laos | 0.0 /100 | #279 | Tragic 86.6% |
| Pueblo | 0.0 /100 | #280 | Tragic 86.5% |
| Indonesians | 0.0 /100 | #281 | Tragic 86.5% |
| Dutch West Indians | 0.0 /100 | #282 | Tragic 86.5% |
| Immigrants | Barbados | 0.0 /100 | #283 | Tragic 86.4% |