Immigrants from Bulgaria vs Black/African American 1st Grade
COMPARE
Immigrants from Bulgaria
Black/African American
1st Grade
1st Grade Comparison
Immigrants from Bulgaria
Blacks/African Americans
98.1%
1ST GRADE
88.8/ 100
METRIC RATING
136th/ 347
METRIC RANK
97.9%
1ST GRADE
30.7/ 100
METRIC RATING
191st/ 347
METRIC RANK
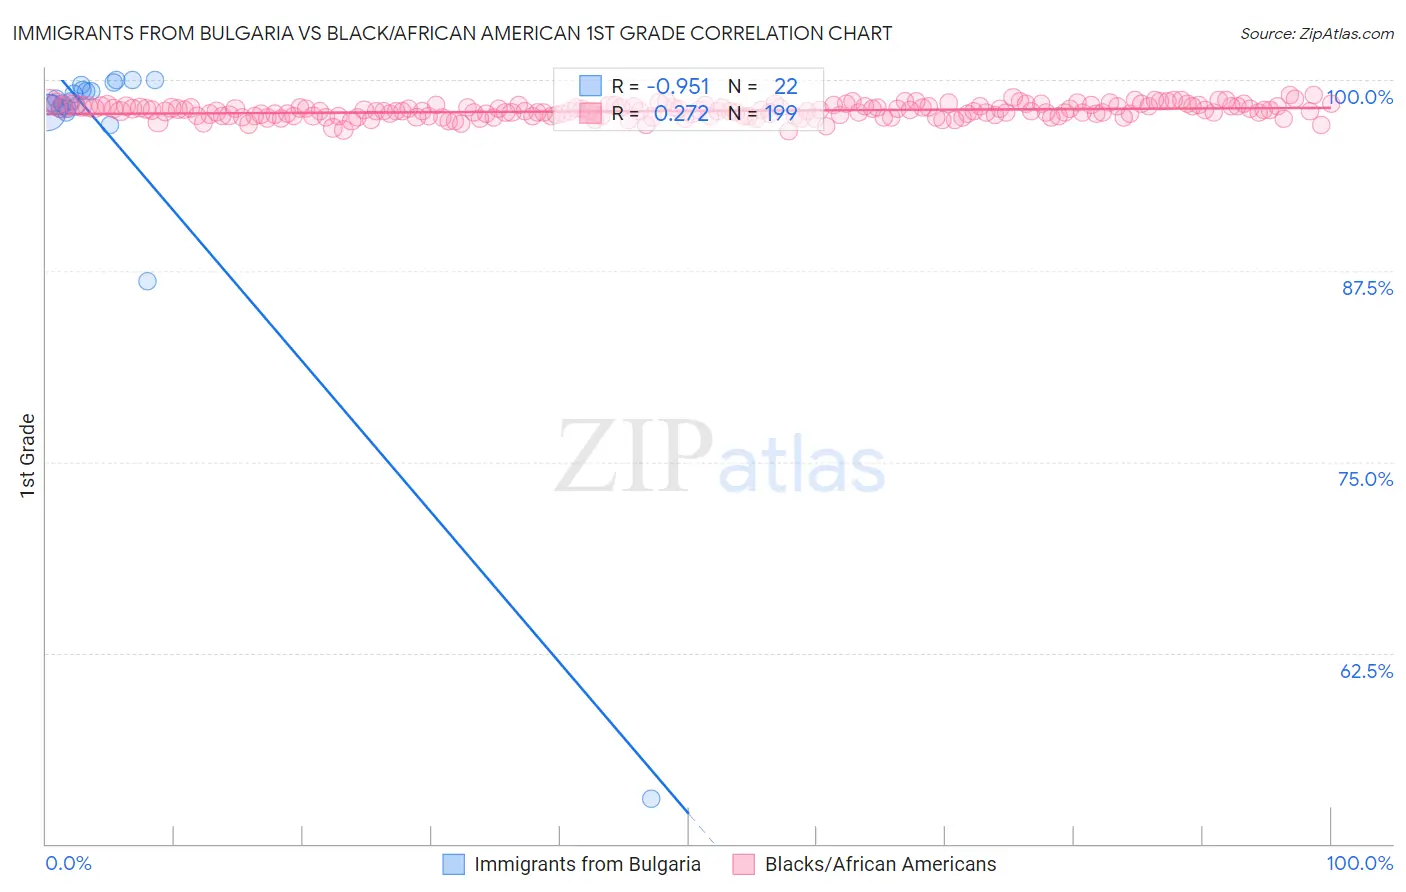
Immigrants from Bulgaria vs Black/African American 1st Grade Correlation Chart
The statistical analysis conducted on geographies consisting of 172,552,181 people shows a perfect negative correlation between the proportion of Immigrants from Bulgaria and percentage of population with at least 1st grade education in the United States with a correlation coefficient (R) of -0.951 and weighted average of 98.1%. Similarly, the statistical analysis conducted on geographies consisting of 566,043,750 people shows a weak positive correlation between the proportion of Blacks/African Americans and percentage of population with at least 1st grade education in the United States with a correlation coefficient (R) of 0.272 and weighted average of 97.9%, a difference of 0.22%.
1st Grade Correlation Summary
| Measurement | Immigrants from Bulgaria | Black/African American |
| Minimum | 52.9% | 96.7% |
| Maximum | 100.0% | 99.0% |
| Range | 47.1% | 2.3% |
| Mean | 96.2% | 98.0% |
| Median | 98.5% | 98.0% |
| Interquartile 25% (IQ1) | 98.1% | 97.6% |
| Interquartile 75% (IQ3) | 99.4% | 98.3% |
| Interquartile Range (IQR) | 1.2% | 0.62% |
| Standard Deviation (Sample) | 10.0% | 0.43% |
| Standard Deviation (Population) | 9.8% | 0.43% |
Similar Demographics by 1st Grade
Demographics Similar to Immigrants from Bulgaria by 1st Grade
In terms of 1st grade, the demographic groups most similar to Immigrants from Bulgaria are Immigrants from Hungary (98.1%, a difference of 0.0%), Immigrants from Kuwait (98.1%, a difference of 0.0%), Immigrants from Europe (98.1%, a difference of 0.010%), Israeli (98.1%, a difference of 0.010%), and Immigrants from Romania (98.1%, a difference of 0.010%).
| Demographics | Rating | Rank | 1st Grade |
| Seminole | 91.9 /100 | #129 | Exceptional 98.1% |
| Immigrants | Croatia | 91.4 /100 | #130 | Exceptional 98.1% |
| Spaniards | 91.2 /100 | #131 | Exceptional 98.1% |
| Cambodians | 90.9 /100 | #132 | Exceptional 98.1% |
| Immigrants | Europe | 90.5 /100 | #133 | Exceptional 98.1% |
| Immigrants | Hungary | 89.4 /100 | #134 | Excellent 98.1% |
| Immigrants | Kuwait | 89.3 /100 | #135 | Excellent 98.1% |
| Immigrants | Bulgaria | 88.8 /100 | #136 | Excellent 98.1% |
| Israelis | 87.8 /100 | #137 | Excellent 98.1% |
| Immigrants | Romania | 87.8 /100 | #138 | Excellent 98.1% |
| Blackfeet | 87.6 /100 | #139 | Excellent 98.1% |
| Palestinians | 83.0 /100 | #140 | Excellent 98.0% |
| Immigrants | Turkey | 82.8 /100 | #141 | Excellent 98.0% |
| Marshallese | 82.0 /100 | #142 | Excellent 98.0% |
| Burmese | 81.0 /100 | #143 | Excellent 98.0% |
Demographics Similar to Blacks/African Americans by 1st Grade
In terms of 1st grade, the demographic groups most similar to Blacks/African Americans are Paraguayan (97.9%, a difference of 0.0%), Immigrants from Taiwan (97.9%, a difference of 0.0%), Panamanian (97.9%, a difference of 0.010%), Mongolian (97.9%, a difference of 0.010%), and Hawaiian (97.9%, a difference of 0.010%).
| Demographics | Rating | Rank | 1st Grade |
| Immigrants | Poland | 40.1 /100 | #184 | Average 97.9% |
| Immigrants | Belarus | 39.3 /100 | #185 | Fair 97.9% |
| Paiute | 36.5 /100 | #186 | Fair 97.9% |
| Pakistanis | 35.8 /100 | #187 | Fair 97.9% |
| Arabs | 35.5 /100 | #188 | Fair 97.9% |
| Immigrants | Kazakhstan | 34.9 /100 | #189 | Fair 97.9% |
| Panamanians | 34.1 /100 | #190 | Fair 97.9% |
| Blacks/African Americans | 30.7 /100 | #191 | Fair 97.9% |
| Paraguayans | 30.2 /100 | #192 | Fair 97.9% |
| Immigrants | Taiwan | 29.4 /100 | #193 | Fair 97.9% |
| Mongolians | 29.2 /100 | #194 | Fair 97.9% |
| Hawaiians | 28.8 /100 | #195 | Fair 97.9% |
| Immigrants | Kenya | 26.3 /100 | #196 | Fair 97.8% |
| Guamanians/Chamorros | 26.2 /100 | #197 | Fair 97.8% |
| Yuman | 24.4 /100 | #198 | Fair 97.8% |