Assyrian/Chaldean/Syriac vs Hopi Doctorate Degree
COMPARE
Assyrian/Chaldean/Syriac
Hopi
Doctorate Degree
Doctorate Degree Comparison
Assyrians/Chaldeans/Syriacs
Hopi
1.7%
DOCTORATE DEGREE
5.9/ 100
METRIC RATING
228th/ 347
METRIC RANK
1.6%
DOCTORATE DEGREE
3.2/ 100
METRIC RATING
234th/ 347
METRIC RANK
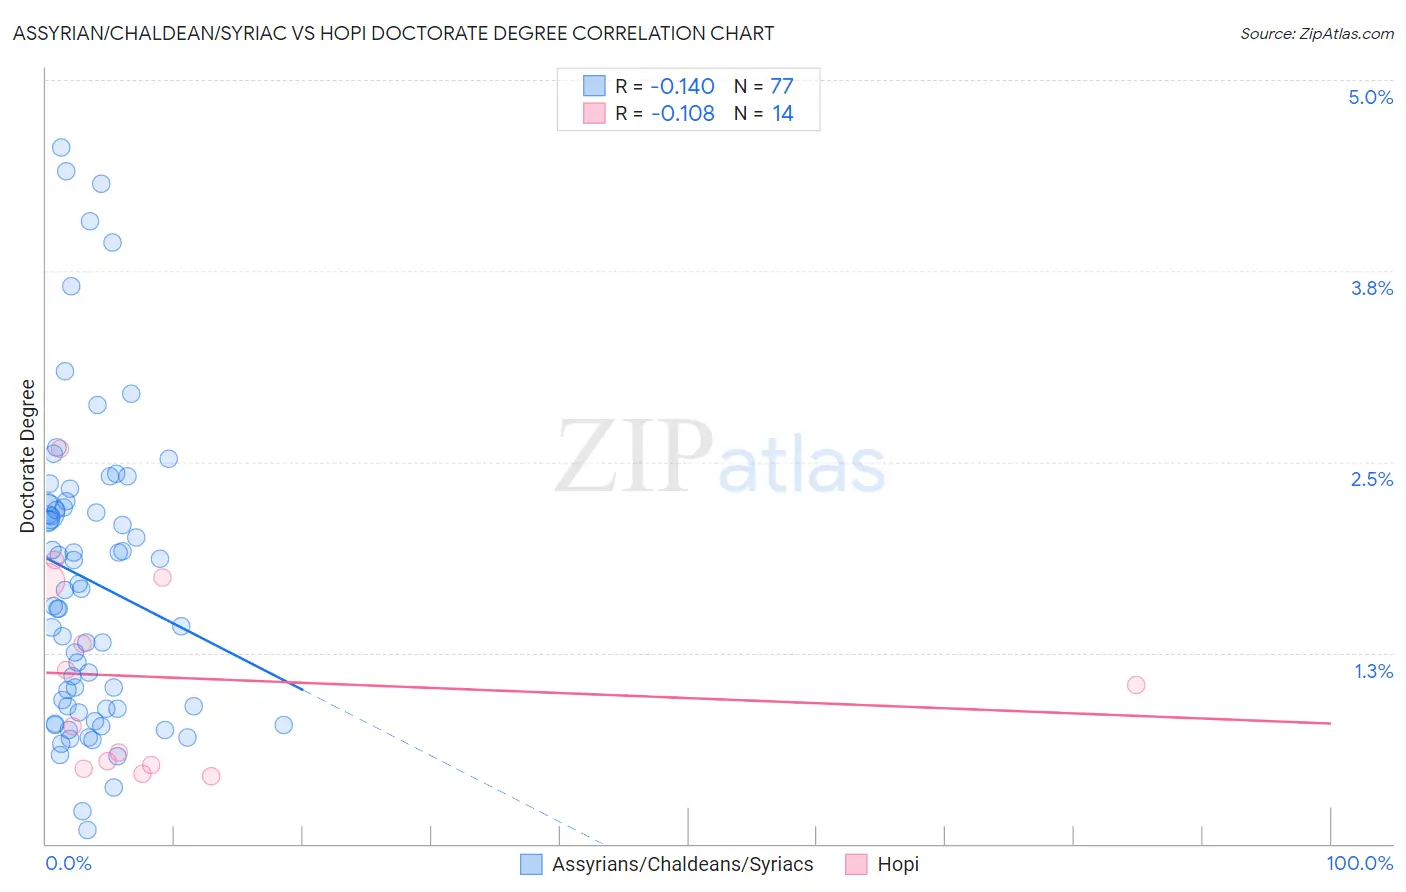
Assyrian/Chaldean/Syriac vs Hopi Doctorate Degree Correlation Chart
The statistical analysis conducted on geographies consisting of 110,001,704 people shows a poor negative correlation between the proportion of Assyrians/Chaldeans/Syriacs and percentage of population with at least doctorate degree education in the United States with a correlation coefficient (R) of -0.140 and weighted average of 1.7%. Similarly, the statistical analysis conducted on geographies consisting of 74,389,288 people shows a poor negative correlation between the proportion of Hopi and percentage of population with at least doctorate degree education in the United States with a correlation coefficient (R) of -0.108 and weighted average of 1.6%, a difference of 2.7%.
Doctorate Degree Correlation Summary
| Measurement | Assyrian/Chaldean/Syriac | Hopi |
| Minimum | 0.087% | 0.44% |
| Maximum | 4.6% | 2.6% |
| Range | 4.5% | 2.1% |
| Mean | 1.7% | 1.1% |
| Median | 1.7% | 0.90% |
| Interquartile 25% (IQ1) | 0.88% | 0.51% |
| Interquartile 75% (IQ3) | 2.2% | 1.7% |
| Interquartile Range (IQR) | 1.3% | 1.2% |
| Standard Deviation (Sample) | 1.0% | 0.67% |
| Standard Deviation (Population) | 1.00% | 0.65% |
Demographics Similar to Assyrians/Chaldeans/Syriacs and Hopi by Doctorate Degree
In terms of doctorate degree, the demographic groups most similar to Assyrians/Chaldeans/Syriacs are Panamanian (1.7%, a difference of 0.28%), Osage (1.7%, a difference of 0.42%), Immigrants from Colombia (1.7%, a difference of 0.53%), Colville (1.6%, a difference of 1.0%), and Immigrants from Poland (1.7%, a difference of 1.0%). Similarly, the demographic groups most similar to Hopi are Barbadian (1.6%, a difference of 0.15%), Guamanian/Chamorro (1.6%, a difference of 0.21%), Cree (1.6%, a difference of 0.21%), Indonesian (1.6%, a difference of 0.50%), and Iroquois (1.6%, a difference of 0.69%).
| Demographics | Rating | Rank | Doctorate Degree |
| Immigrants | Nonimmigrants | 8.8 /100 | #221 | Tragic 1.7% |
| Immigrants | Venezuela | 8.7 /100 | #222 | Tragic 1.7% |
| Immigrants | Bosnia and Herzegovina | 7.8 /100 | #223 | Tragic 1.7% |
| Immigrants | Poland | 7.4 /100 | #224 | Tragic 1.7% |
| Immigrants | Colombia | 6.7 /100 | #225 | Tragic 1.7% |
| Osage | 6.5 /100 | #226 | Tragic 1.7% |
| Panamanians | 6.3 /100 | #227 | Tragic 1.7% |
| Assyrians/Chaldeans/Syriacs | 5.9 /100 | #228 | Tragic 1.7% |
| Colville | 4.7 /100 | #229 | Tragic 1.6% |
| Immigrants | Philippines | 4.3 /100 | #230 | Tragic 1.6% |
| Immigrants | North Macedonia | 3.9 /100 | #231 | Tragic 1.6% |
| Guamanians/Chamorros | 3.3 /100 | #232 | Tragic 1.6% |
| Barbadians | 3.3 /100 | #233 | Tragic 1.6% |
| Hopi | 3.2 /100 | #234 | Tragic 1.6% |
| Cree | 3.0 /100 | #235 | Tragic 1.6% |
| Indonesians | 2.8 /100 | #236 | Tragic 1.6% |
| Iroquois | 2.7 /100 | #237 | Tragic 1.6% |
| Immigrants | Congo | 2.6 /100 | #238 | Tragic 1.6% |
| West Indians | 2.5 /100 | #239 | Tragic 1.6% |
| Immigrants | Panama | 2.4 /100 | #240 | Tragic 1.6% |
| Cheyenne | 2.3 /100 | #241 | Tragic 1.6% |