Macedonian vs Immigrants from Canada 12th Grade, No Diploma
COMPARE
Macedonian
Immigrants from Canada
12th Grade, No Diploma
12th Grade, No Diploma Comparison
Macedonians
Immigrants from Canada
92.9%
12TH GRADE, NO DIPLOMA
99.8/ 100
METRIC RATING
49th/ 347
METRIC RANK
92.8%
12TH GRADE, NO DIPLOMA
99.7/ 100
METRIC RATING
57th/ 347
METRIC RANK
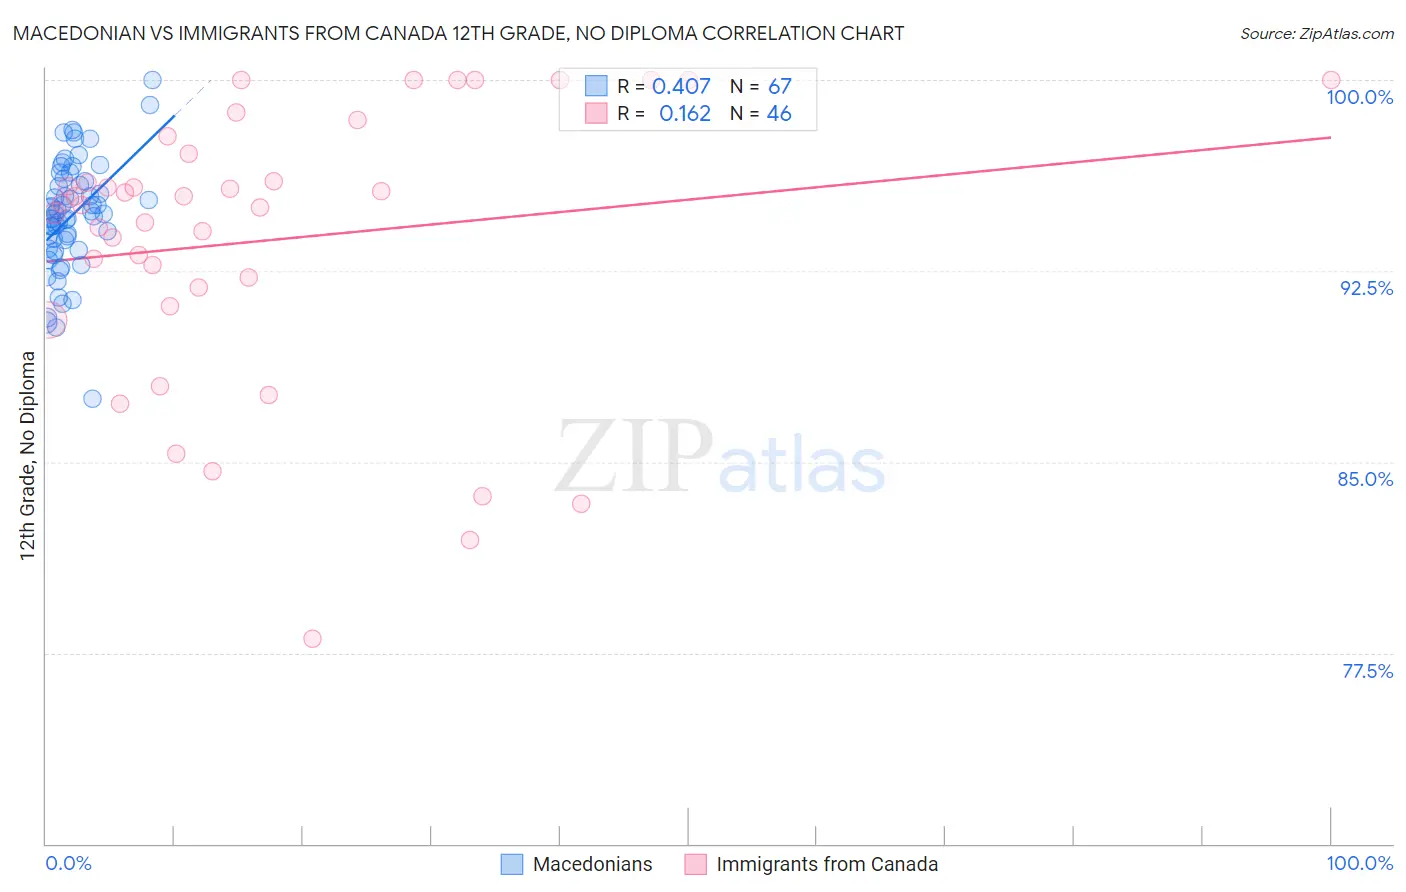
Macedonian vs Immigrants from Canada 12th Grade, No Diploma Correlation Chart
The statistical analysis conducted on geographies consisting of 132,645,902 people shows a moderate positive correlation between the proportion of Macedonians and percentage of population with at least 12th grade (no diploma) education in the United States with a correlation coefficient (R) of 0.407 and weighted average of 92.9%. Similarly, the statistical analysis conducted on geographies consisting of 459,397,067 people shows a poor positive correlation between the proportion of Immigrants from Canada and percentage of population with at least 12th grade (no diploma) education in the United States with a correlation coefficient (R) of 0.162 and weighted average of 92.8%, a difference of 0.080%.
12th Grade, No Diploma Correlation Summary
| Measurement | Macedonian | Immigrants from Canada |
| Minimum | 87.5% | 78.1% |
| Maximum | 100.0% | 100.0% |
| Range | 12.5% | 21.9% |
| Mean | 94.6% | 93.7% |
| Median | 94.8% | 95.1% |
| Interquartile 25% (IQ1) | 93.4% | 91.9% |
| Interquartile 75% (IQ3) | 96.0% | 97.1% |
| Interquartile Range (IQR) | 2.6% | 5.2% |
| Standard Deviation (Sample) | 2.2% | 5.4% |
| Standard Deviation (Population) | 2.2% | 5.4% |
Demographics Similar to Macedonians and Immigrants from Canada by 12th Grade, No Diploma
In terms of 12th grade, no diploma, the demographic groups most similar to Macedonians are Australian (92.9%, a difference of 0.010%), Tsimshian (92.9%, a difference of 0.010%), Immigrants from Belgium (92.9%, a difference of 0.010%), Belgian (92.9%, a difference of 0.020%), and British (92.9%, a difference of 0.030%). Similarly, the demographic groups most similar to Immigrants from Canada are Immigrants from Taiwan (92.8%, a difference of 0.020%), Welsh (92.8%, a difference of 0.030%), New Zealander (92.8%, a difference of 0.030%), Immigrants from North America (92.8%, a difference of 0.030%), and Slavic (92.8%, a difference of 0.030%).
| Demographics | Rating | Rank | 12th Grade, No Diploma |
| Northern Europeans | 99.8 /100 | #43 | Exceptional 92.9% |
| Dutch | 99.8 /100 | #44 | Exceptional 92.9% |
| Greeks | 99.8 /100 | #45 | Exceptional 92.9% |
| British | 99.8 /100 | #46 | Exceptional 92.9% |
| Belgians | 99.8 /100 | #47 | Exceptional 92.9% |
| Australians | 99.8 /100 | #48 | Exceptional 92.9% |
| Macedonians | 99.8 /100 | #49 | Exceptional 92.9% |
| Tsimshian | 99.8 /100 | #50 | Exceptional 92.9% |
| Immigrants | Belgium | 99.8 /100 | #51 | Exceptional 92.9% |
| Immigrants | Sweden | 99.8 /100 | #52 | Exceptional 92.8% |
| Serbians | 99.7 /100 | #53 | Exceptional 92.8% |
| Hungarians | 99.7 /100 | #54 | Exceptional 92.8% |
| Welsh | 99.7 /100 | #55 | Exceptional 92.8% |
| New Zealanders | 99.7 /100 | #56 | Exceptional 92.8% |
| Immigrants | Canada | 99.7 /100 | #57 | Exceptional 92.8% |
| Immigrants | Taiwan | 99.7 /100 | #58 | Exceptional 92.8% |
| Immigrants | North America | 99.7 /100 | #59 | Exceptional 92.8% |
| Slavs | 99.7 /100 | #60 | Exceptional 92.8% |
| Immigrants | Japan | 99.7 /100 | #61 | Exceptional 92.8% |
| Ukrainians | 99.6 /100 | #62 | Exceptional 92.7% |
| Zimbabweans | 99.6 /100 | #63 | Exceptional 92.7% |