Immigrants from Norway vs Immigrants from Kuwait High School Diploma
COMPARE
Immigrants from Norway
Immigrants from Kuwait
High School Diploma
High School Diploma Comparison
Immigrants from Norway
Immigrants from Kuwait
90.5%
HIGH SCHOOL DIPLOMA
98.0/ 100
METRIC RATING
101st/ 347
METRIC RANK
90.5%
HIGH SCHOOL DIPLOMA
98.3/ 100
METRIC RATING
97th/ 347
METRIC RANK
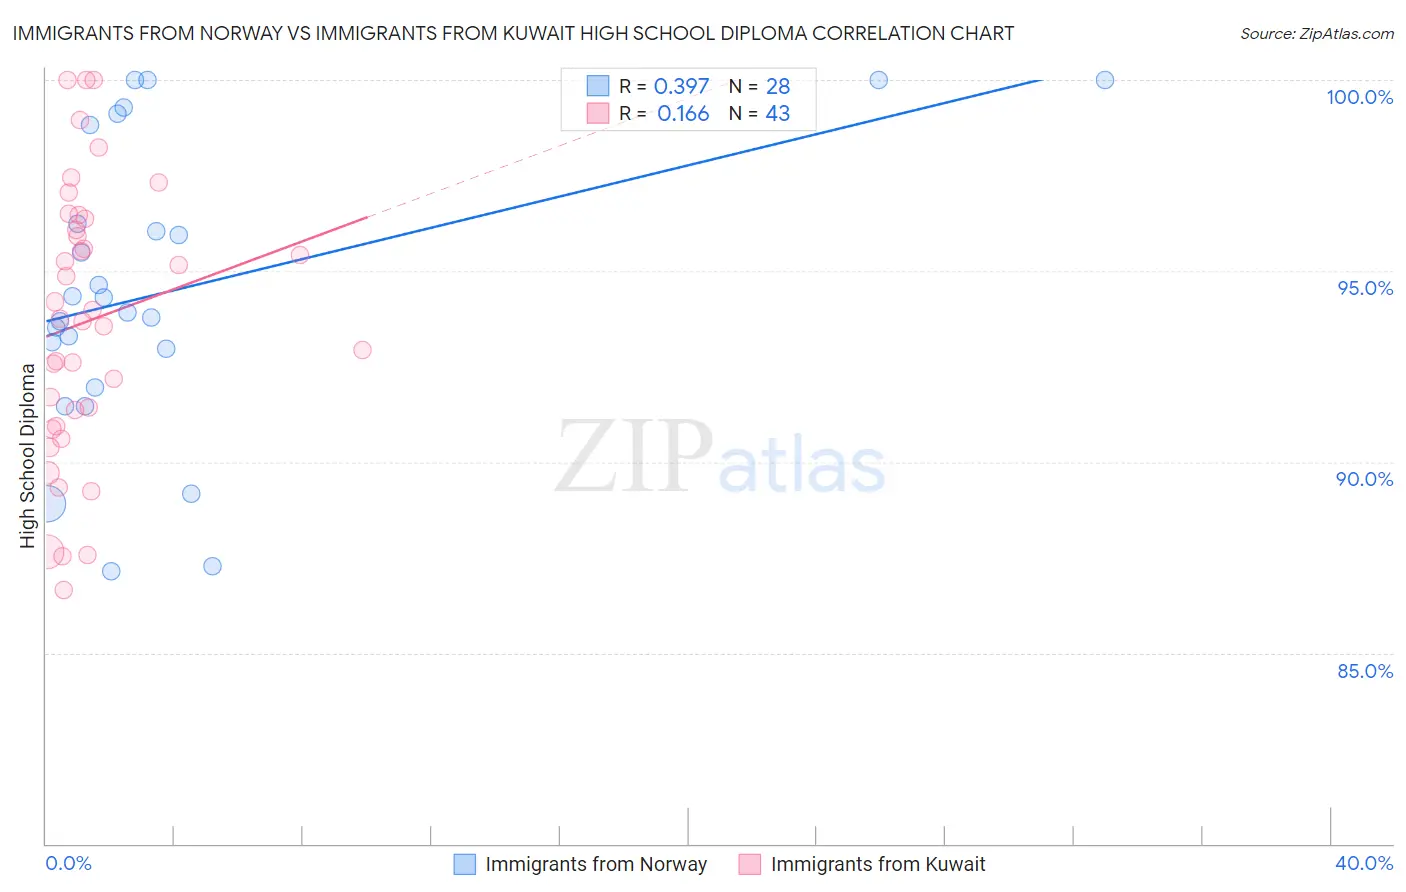
Immigrants from Norway vs Immigrants from Kuwait High School Diploma Correlation Chart
The statistical analysis conducted on geographies consisting of 116,716,356 people shows a mild positive correlation between the proportion of Immigrants from Norway and percentage of population with at least high school diploma education in the United States with a correlation coefficient (R) of 0.397 and weighted average of 90.5%. Similarly, the statistical analysis conducted on geographies consisting of 136,917,085 people shows a poor positive correlation between the proportion of Immigrants from Kuwait and percentage of population with at least high school diploma education in the United States with a correlation coefficient (R) of 0.166 and weighted average of 90.5%, a difference of 0.050%.
High School Diploma Correlation Summary
| Measurement | Immigrants from Norway | Immigrants from Kuwait |
| Minimum | 87.1% | 86.7% |
| Maximum | 100.0% | 100.0% |
| Range | 12.9% | 13.3% |
| Mean | 94.5% | 93.7% |
| Median | 94.1% | 93.7% |
| Interquartile 25% (IQ1) | 92.4% | 90.9% |
| Interquartile 75% (IQ3) | 97.5% | 96.4% |
| Interquartile Range (IQR) | 5.1% | 5.4% |
| Standard Deviation (Sample) | 3.8% | 3.6% |
| Standard Deviation (Population) | 3.7% | 3.5% |
Demographics Similar to Immigrants from Norway and Immigrants from Kuwait by High School Diploma
In terms of high school diploma, the demographic groups most similar to Immigrants from Norway are Aleut (90.4%, a difference of 0.010%), Immigrants from North Macedonia (90.5%, a difference of 0.020%), Immigrants from Europe (90.5%, a difference of 0.030%), Immigrants from Romania (90.4%, a difference of 0.030%), and Immigrants from Croatia (90.4%, a difference of 0.040%). Similarly, the demographic groups most similar to Immigrants from Kuwait are Immigrants from Korea (90.5%, a difference of 0.0%), Immigrants from Europe (90.5%, a difference of 0.020%), Immigrants from Serbia (90.5%, a difference of 0.030%), Immigrants from North Macedonia (90.5%, a difference of 0.030%), and Immigrants from Israel (90.5%, a difference of 0.040%).
| Demographics | Rating | Rank | High School Diploma |
| Canadians | 98.7 /100 | #89 | Exceptional 90.6% |
| Celtics | 98.7 /100 | #90 | Exceptional 90.6% |
| South Africans | 98.6 /100 | #91 | Exceptional 90.6% |
| Swiss | 98.6 /100 | #92 | Exceptional 90.6% |
| Immigrants | Western Europe | 98.6 /100 | #93 | Exceptional 90.6% |
| Immigrants | Israel | 98.5 /100 | #94 | Exceptional 90.5% |
| Icelanders | 98.5 /100 | #95 | Exceptional 90.5% |
| Immigrants | Serbia | 98.4 /100 | #96 | Exceptional 90.5% |
| Immigrants | Kuwait | 98.3 /100 | #97 | Exceptional 90.5% |
| Immigrants | Korea | 98.3 /100 | #98 | Exceptional 90.5% |
| Immigrants | Europe | 98.2 /100 | #99 | Exceptional 90.5% |
| Immigrants | North Macedonia | 98.1 /100 | #100 | Exceptional 90.5% |
| Immigrants | Norway | 98.0 /100 | #101 | Exceptional 90.5% |
| Aleuts | 98.0 /100 | #102 | Exceptional 90.4% |
| Immigrants | Romania | 97.8 /100 | #103 | Exceptional 90.4% |
| Immigrants | Croatia | 97.8 /100 | #104 | Exceptional 90.4% |
| Lebanese | 97.4 /100 | #105 | Exceptional 90.4% |
| Syrians | 97.0 /100 | #106 | Exceptional 90.3% |
| Immigrants | Russia | 96.9 /100 | #107 | Exceptional 90.3% |
| Palestinians | 96.7 /100 | #108 | Exceptional 90.3% |
| Immigrants | Zimbabwe | 96.7 /100 | #109 | Exceptional 90.3% |