Puget Sound Salish vs Bhutanese 12th Grade, No Diploma
COMPARE
Puget Sound Salish
Bhutanese
12th Grade, No Diploma
12th Grade, No Diploma Comparison
Puget Sound Salish
Bhutanese
92.0%
12TH GRADE, NO DIPLOMA
95.8/ 100
METRIC RATING
118th/ 347
METRIC RANK
93.0%
12TH GRADE, NO DIPLOMA
99.8/ 100
METRIC RATING
41st/ 347
METRIC RANK
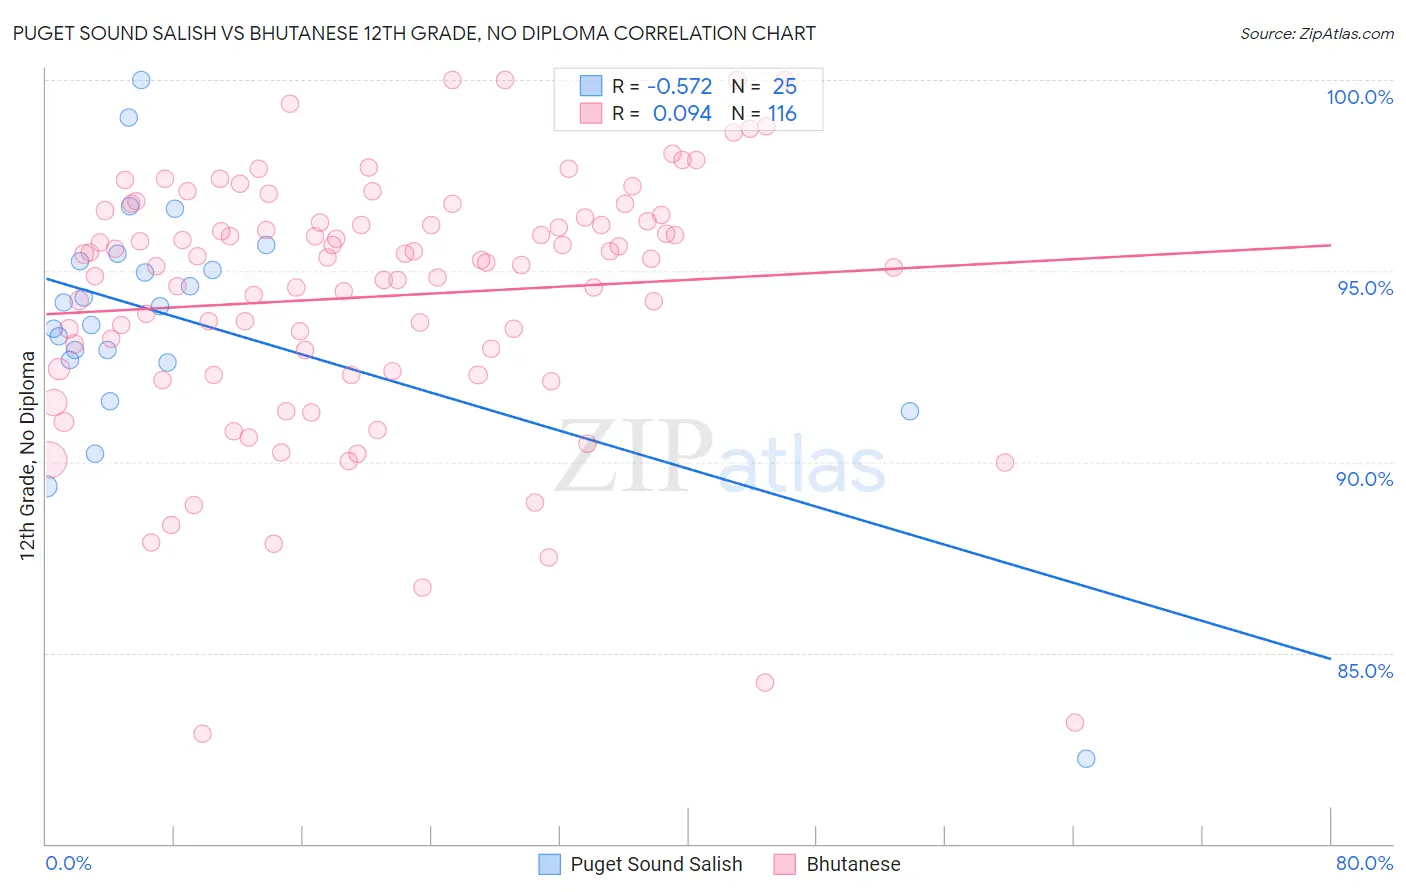
Puget Sound Salish vs Bhutanese 12th Grade, No Diploma Correlation Chart
The statistical analysis conducted on geographies consisting of 46,155,775 people shows a substantial negative correlation between the proportion of Puget Sound Salish and percentage of population with at least 12th grade (no diploma) education in the United States with a correlation coefficient (R) of -0.572 and weighted average of 92.0%. Similarly, the statistical analysis conducted on geographies consisting of 455,591,134 people shows a slight positive correlation between the proportion of Bhutanese and percentage of population with at least 12th grade (no diploma) education in the United States with a correlation coefficient (R) of 0.094 and weighted average of 93.0%, a difference of 0.99%.
12th Grade, No Diploma Correlation Summary
| Measurement | Puget Sound Salish | Bhutanese |
| Minimum | 82.2% | 82.9% |
| Maximum | 100.0% | 100.0% |
| Range | 17.8% | 17.1% |
| Mean | 93.7% | 94.3% |
| Median | 94.1% | 95.3% |
| Interquartile 25% (IQ1) | 92.6% | 92.4% |
| Interquartile 75% (IQ3) | 95.3% | 96.4% |
| Interquartile Range (IQR) | 2.7% | 4.0% |
| Standard Deviation (Sample) | 3.4% | 3.4% |
| Standard Deviation (Population) | 3.3% | 3.4% |
Similar Demographics by 12th Grade, No Diploma
Demographics Similar to Puget Sound Salish by 12th Grade, No Diploma
In terms of 12th grade, no diploma, the demographic groups most similar to Puget Sound Salish are Immigrants from Germany (92.0%, a difference of 0.030%), Aleut (92.1%, a difference of 0.040%), Immigrants from Eastern Europe (92.1%, a difference of 0.040%), Immigrants from Zimbabwe (92.1%, a difference of 0.050%), and Yugoslavian (92.1%, a difference of 0.050%).
| Demographics | Rating | Rank | 12th Grade, No Diploma |
| Immigrants | Greece | 96.9 /100 | #111 | Exceptional 92.1% |
| Israelis | 96.8 /100 | #112 | Exceptional 92.1% |
| Immigrants | Zimbabwe | 96.5 /100 | #113 | Exceptional 92.1% |
| Yugoslavians | 96.5 /100 | #114 | Exceptional 92.1% |
| Immigrants | Sri Lanka | 96.4 /100 | #115 | Exceptional 92.1% |
| Aleuts | 96.3 /100 | #116 | Exceptional 92.1% |
| Immigrants | Eastern Europe | 96.3 /100 | #117 | Exceptional 92.1% |
| Puget Sound Salish | 95.8 /100 | #118 | Exceptional 92.0% |
| Immigrants | Germany | 95.5 /100 | #119 | Exceptional 92.0% |
| Immigrants | Kazakhstan | 94.2 /100 | #120 | Exceptional 91.9% |
| Menominee | 93.5 /100 | #121 | Exceptional 91.9% |
| Ottawa | 93.1 /100 | #122 | Exceptional 91.9% |
| Egyptians | 92.5 /100 | #123 | Exceptional 91.9% |
| Immigrants | Ukraine | 91.6 /100 | #124 | Exceptional 91.8% |
| Whites/Caucasians | 91.6 /100 | #125 | Exceptional 91.8% |
Demographics Similar to Bhutanese by 12th Grade, No Diploma
In terms of 12th grade, no diploma, the demographic groups most similar to Bhutanese are Turkish (93.0%, a difference of 0.0%), Tlingit-Haida (93.0%, a difference of 0.010%), Immigrants from Austria (93.0%, a difference of 0.010%), Immigrants from Australia (92.9%, a difference of 0.020%), and Northern European (92.9%, a difference of 0.030%).
| Demographics | Rating | Rank | 12th Grade, No Diploma |
| Okinawans | 99.9 /100 | #34 | Exceptional 93.0% |
| English | 99.9 /100 | #35 | Exceptional 93.0% |
| Scottish | 99.9 /100 | #36 | Exceptional 93.0% |
| Irish | 99.9 /100 | #37 | Exceptional 93.0% |
| Tlingit-Haida | 99.8 /100 | #38 | Exceptional 93.0% |
| Immigrants | Austria | 99.8 /100 | #39 | Exceptional 93.0% |
| Turks | 99.8 /100 | #40 | Exceptional 93.0% |
| Bhutanese | 99.8 /100 | #41 | Exceptional 93.0% |
| Immigrants | Australia | 99.8 /100 | #42 | Exceptional 92.9% |
| Northern Europeans | 99.8 /100 | #43 | Exceptional 92.9% |
| Dutch | 99.8 /100 | #44 | Exceptional 92.9% |
| Greeks | 99.8 /100 | #45 | Exceptional 92.9% |
| British | 99.8 /100 | #46 | Exceptional 92.9% |
| Belgians | 99.8 /100 | #47 | Exceptional 92.9% |
| Australians | 99.8 /100 | #48 | Exceptional 92.9% |