Puget Sound Salish vs Nicaraguan 4th Grade
COMPARE
Puget Sound Salish
Nicaraguan
4th Grade
4th Grade Comparison
Puget Sound Salish
Nicaraguans
97.9%
4TH GRADE
97.7/ 100
METRIC RATING
103rd/ 347
METRIC RANK
96.2%
4TH GRADE
0.0/ 100
METRIC RATING
315th/ 347
METRIC RANK
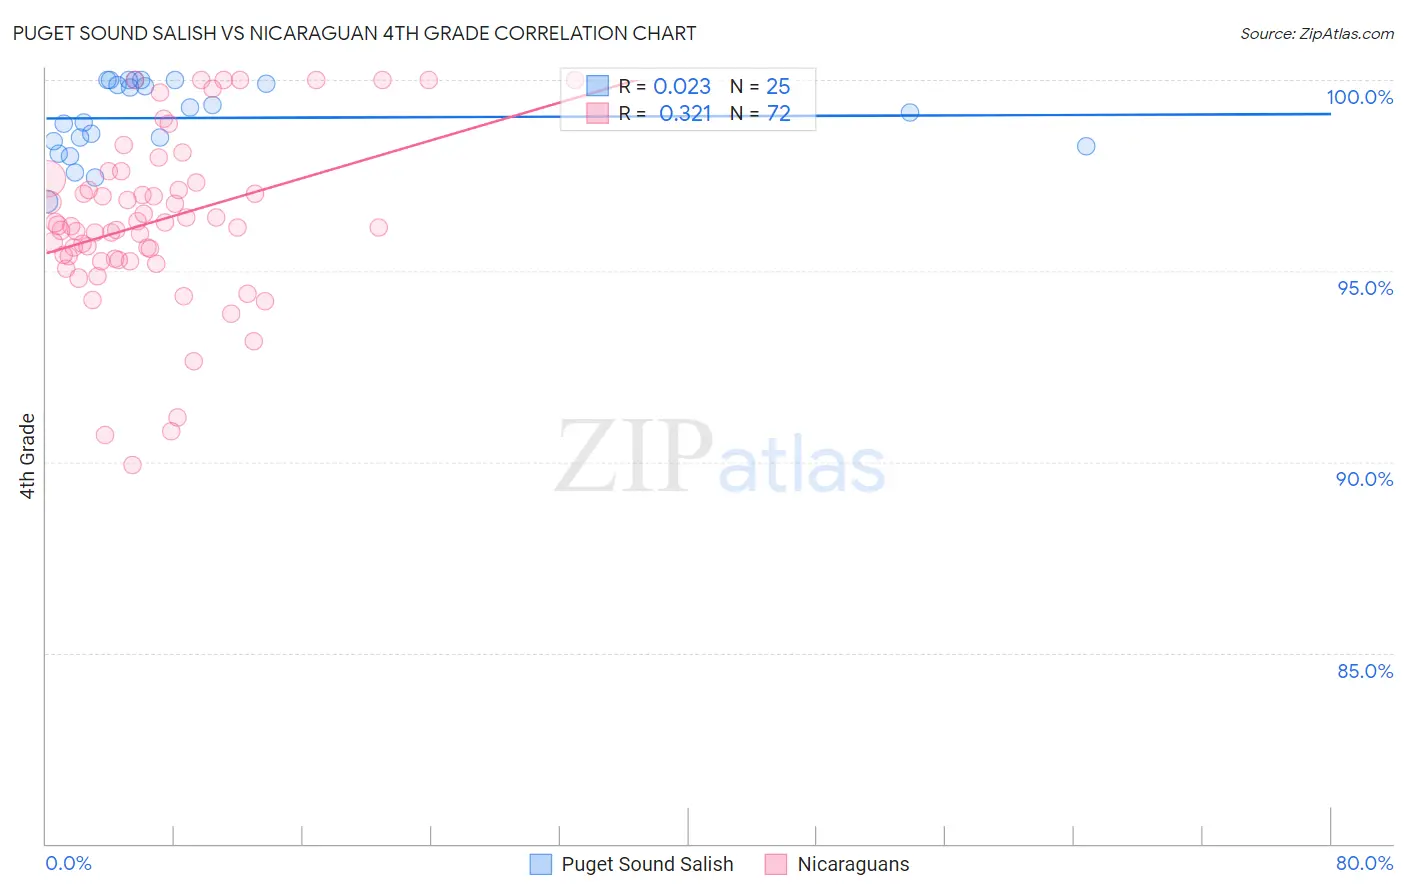
Puget Sound Salish vs Nicaraguan 4th Grade Correlation Chart
The statistical analysis conducted on geographies consisting of 46,155,746 people shows no correlation between the proportion of Puget Sound Salish and percentage of population with at least 4th grade education in the United States with a correlation coefficient (R) of 0.023 and weighted average of 97.9%. Similarly, the statistical analysis conducted on geographies consisting of 285,711,389 people shows a mild positive correlation between the proportion of Nicaraguans and percentage of population with at least 4th grade education in the United States with a correlation coefficient (R) of 0.321 and weighted average of 96.2%, a difference of 1.7%.
4th Grade Correlation Summary
| Measurement | Puget Sound Salish | Nicaraguan |
| Minimum | 96.8% | 89.9% |
| Maximum | 100.0% | 100.0% |
| Range | 3.2% | 10.1% |
| Mean | 99.0% | 96.3% |
| Median | 99.2% | 96.2% |
| Interquartile 25% (IQ1) | 98.3% | 95.3% |
| Interquartile 75% (IQ3) | 100.0% | 97.4% |
| Interquartile Range (IQR) | 1.6% | 2.0% |
| Standard Deviation (Sample) | 0.95% | 2.2% |
| Standard Deviation (Population) | 0.94% | 2.2% |
Similar Demographics by 4th Grade
Demographics Similar to Puget Sound Salish by 4th Grade
In terms of 4th grade, the demographic groups most similar to Puget Sound Salish are Choctaw (97.9%, a difference of 0.010%), Nonimmigrants (97.9%, a difference of 0.010%), German Russian (97.9%, a difference of 0.010%), Immigrants from Czechoslovakia (97.9%, a difference of 0.010%), and Bhutanese (97.9%, a difference of 0.010%).
| Demographics | Rating | Rank | 4th Grade |
| Romanians | 98.4 /100 | #96 | Exceptional 97.9% |
| Cheyenne | 98.4 /100 | #97 | Exceptional 97.9% |
| South Africans | 98.2 /100 | #98 | Exceptional 97.9% |
| Turks | 98.2 /100 | #99 | Exceptional 97.9% |
| Yugoslavians | 98.1 /100 | #100 | Exceptional 97.9% |
| Cree | 98.1 /100 | #101 | Exceptional 97.9% |
| Choctaw | 97.9 /100 | #102 | Exceptional 97.9% |
| Puget Sound Salish | 97.7 /100 | #103 | Exceptional 97.9% |
| Immigrants | Nonimmigrants | 97.5 /100 | #104 | Exceptional 97.9% |
| German Russians | 97.5 /100 | #105 | Exceptional 97.9% |
| Immigrants | Czechoslovakia | 97.5 /100 | #106 | Exceptional 97.9% |
| Bhutanese | 97.4 /100 | #107 | Exceptional 97.9% |
| Immigrants | Singapore | 97.3 /100 | #108 | Exceptional 97.9% |
| Immigrants | Latvia | 96.8 /100 | #109 | Exceptional 97.8% |
| Thais | 96.7 /100 | #110 | Exceptional 97.8% |
Demographics Similar to Nicaraguans by 4th Grade
In terms of 4th grade, the demographic groups most similar to Nicaraguans are Indonesian (96.2%, a difference of 0.010%), Vietnamese (96.2%, a difference of 0.010%), Immigrants from Ecuador (96.2%, a difference of 0.010%), Immigrants from Bangladesh (96.2%, a difference of 0.030%), and Cape Verdean (96.2%, a difference of 0.030%).
| Demographics | Rating | Rank | 4th Grade |
| Immigrants | Laos | 0.0 /100 | #308 | Tragic 96.3% |
| Immigrants | Guyana | 0.0 /100 | #309 | Tragic 96.3% |
| Immigrants | Burma/Myanmar | 0.0 /100 | #310 | Tragic 96.3% |
| Immigrants | Bangladesh | 0.0 /100 | #311 | Tragic 96.2% |
| Cape Verdeans | 0.0 /100 | #312 | Tragic 96.2% |
| Indonesians | 0.0 /100 | #313 | Tragic 96.2% |
| Vietnamese | 0.0 /100 | #314 | Tragic 96.2% |
| Nicaraguans | 0.0 /100 | #315 | Tragic 96.2% |
| Immigrants | Ecuador | 0.0 /100 | #316 | Tragic 96.2% |
| Central American Indians | 0.0 /100 | #317 | Tragic 96.2% |
| Immigrants | Azores | 0.0 /100 | #318 | Tragic 96.1% |
| Belizeans | 0.0 /100 | #319 | Tragic 96.1% |
| Bangladeshis | 0.0 /100 | #320 | Tragic 96.1% |
| Japanese | 0.0 /100 | #321 | Tragic 96.0% |
| Immigrants | Vietnam | 0.0 /100 | #322 | Tragic 96.0% |