Immigrants from Denmark vs Uruguayan 11th Grade
COMPARE
Immigrants from Denmark
Uruguayan
11th Grade
11th Grade Comparison
Immigrants from Denmark
Uruguayans
93.7%
11TH GRADE
99.5/ 100
METRIC RATING
79th/ 347
METRIC RANK
91.8%
11TH GRADE
3.5/ 100
METRIC RATING
232nd/ 347
METRIC RANK
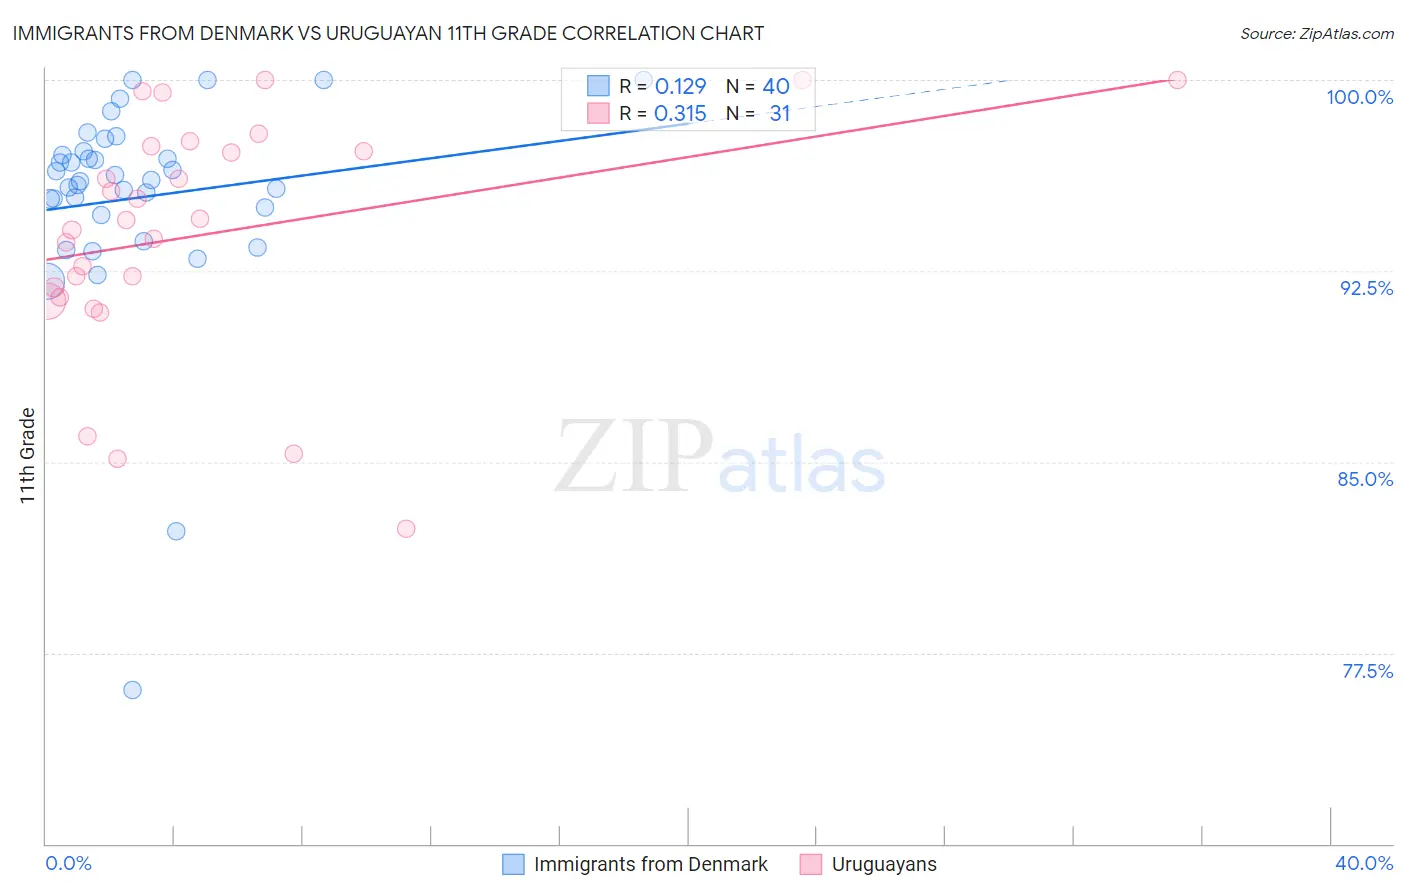
Immigrants from Denmark vs Uruguayan 11th Grade Correlation Chart
The statistical analysis conducted on geographies consisting of 136,430,715 people shows a poor positive correlation between the proportion of Immigrants from Denmark and percentage of population with at least 11th grade education in the United States with a correlation coefficient (R) of 0.129 and weighted average of 93.7%. Similarly, the statistical analysis conducted on geographies consisting of 144,782,615 people shows a mild positive correlation between the proportion of Uruguayans and percentage of population with at least 11th grade education in the United States with a correlation coefficient (R) of 0.315 and weighted average of 91.8%, a difference of 2.1%.
11th Grade Correlation Summary
| Measurement | Immigrants from Denmark | Uruguayan |
| Minimum | 76.1% | 82.4% |
| Maximum | 100.0% | 100.0% |
| Range | 23.9% | 17.6% |
| Mean | 95.4% | 94.0% |
| Median | 96.0% | 94.5% |
| Interquartile 25% (IQ1) | 94.8% | 91.5% |
| Interquartile 75% (IQ3) | 97.1% | 97.4% |
| Interquartile Range (IQR) | 2.3% | 5.9% |
| Standard Deviation (Sample) | 4.4% | 4.6% |
| Standard Deviation (Population) | 4.3% | 4.6% |
Similar Demographics by 11th Grade
Demographics Similar to Immigrants from Denmark by 11th Grade
In terms of 11th grade, the demographic groups most similar to Immigrants from Denmark are Celtic (93.7%, a difference of 0.010%), Aleut (93.7%, a difference of 0.010%), Soviet Union (93.7%, a difference of 0.010%), Canadian (93.7%, a difference of 0.020%), and Immigrants from Moldova (93.7%, a difference of 0.020%).
| Demographics | Rating | Rank | 11th Grade |
| Immigrants | Japan | 99.7 /100 | #72 | Exceptional 93.8% |
| Romanians | 99.6 /100 | #73 | Exceptional 93.8% |
| Immigrants | Czechoslovakia | 99.6 /100 | #74 | Exceptional 93.8% |
| Immigrants | Latvia | 99.6 /100 | #75 | Exceptional 93.8% |
| Celtics | 99.5 /100 | #76 | Exceptional 93.7% |
| Aleuts | 99.5 /100 | #77 | Exceptional 93.7% |
| Soviet Union | 99.5 /100 | #78 | Exceptional 93.7% |
| Immigrants | Denmark | 99.5 /100 | #79 | Exceptional 93.7% |
| Canadians | 99.5 /100 | #80 | Exceptional 93.7% |
| Immigrants | Moldova | 99.5 /100 | #81 | Exceptional 93.7% |
| Immigrants | Saudi Arabia | 99.3 /100 | #82 | Exceptional 93.7% |
| Icelanders | 99.3 /100 | #83 | Exceptional 93.6% |
| Immigrants | Taiwan | 99.3 /100 | #84 | Exceptional 93.6% |
| Immigrants | Switzerland | 99.3 /100 | #85 | Exceptional 93.6% |
| Immigrants | South Central Asia | 99.2 /100 | #86 | Exceptional 93.6% |
Demographics Similar to Uruguayans by 11th Grade
In terms of 11th grade, the demographic groups most similar to Uruguayans are Cheyenne (91.8%, a difference of 0.010%), Choctaw (91.8%, a difference of 0.020%), Immigrants from Afghanistan (91.8%, a difference of 0.030%), Armenian (91.7%, a difference of 0.040%), and Nigerian (91.8%, a difference of 0.050%).
| Demographics | Rating | Rank | 11th Grade |
| Immigrants | Zaire | 5.4 /100 | #225 | Tragic 91.9% |
| Immigrants | Somalia | 5.2 /100 | #226 | Tragic 91.9% |
| Immigrants | Cameroon | 4.4 /100 | #227 | Tragic 91.8% |
| Immigrants | Panama | 4.3 /100 | #228 | Tragic 91.8% |
| Nigerians | 4.3 /100 | #229 | Tragic 91.8% |
| Immigrants | Afghanistan | 3.9 /100 | #230 | Tragic 91.8% |
| Choctaw | 3.7 /100 | #231 | Tragic 91.8% |
| Uruguayans | 3.5 /100 | #232 | Tragic 91.8% |
| Cheyenne | 3.3 /100 | #233 | Tragic 91.8% |
| Armenians | 2.9 /100 | #234 | Tragic 91.7% |
| Sub-Saharan Africans | 2.9 /100 | #235 | Tragic 91.7% |
| Colombians | 2.8 /100 | #236 | Tragic 91.7% |
| Immigrants | Bolivia | 2.8 /100 | #237 | Tragic 91.7% |
| Comanche | 2.6 /100 | #238 | Tragic 91.7% |
| Hopi | 2.5 /100 | #239 | Tragic 91.7% |