Polish vs South African GED/Equivalency
COMPARE
Polish
South African
GED/Equivalency
GED/Equivalency Comparison
Poles
South Africans
88.5%
GED/EQUIVALENCY
99.8/ 100
METRIC RATING
29th/ 347
METRIC RANK
87.5%
GED/EQUIVALENCY
98.3/ 100
METRIC RATING
83rd/ 347
METRIC RANK
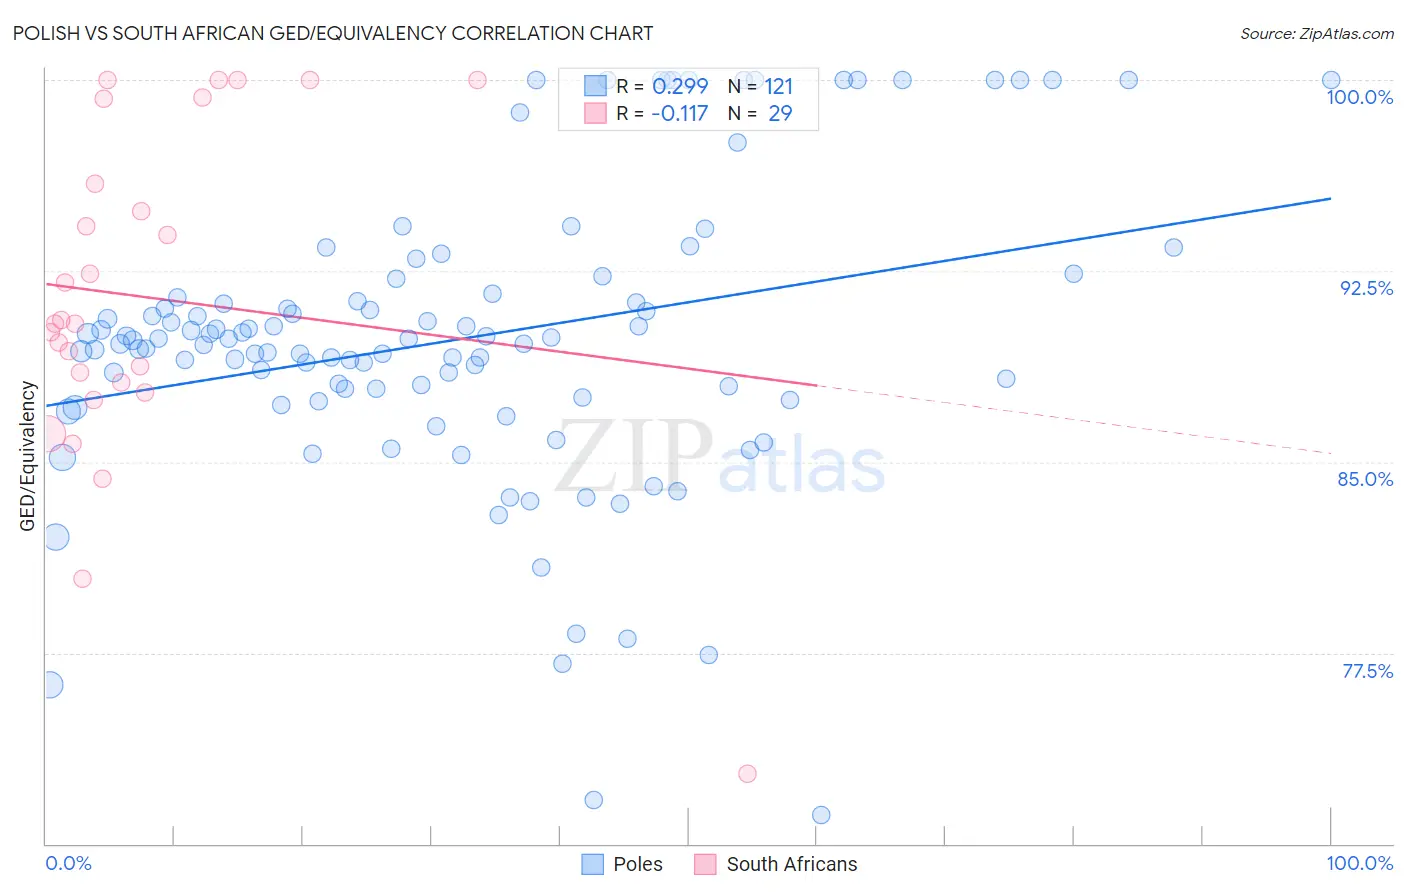
Polish vs South African GED/Equivalency Correlation Chart
The statistical analysis conducted on geographies consisting of 560,593,858 people shows a weak positive correlation between the proportion of Poles and percentage of population with at least ged/equivalency education in the United States with a correlation coefficient (R) of 0.299 and weighted average of 88.5%. Similarly, the statistical analysis conducted on geographies consisting of 182,604,532 people shows a poor negative correlation between the proportion of South Africans and percentage of population with at least ged/equivalency education in the United States with a correlation coefficient (R) of -0.117 and weighted average of 87.5%, a difference of 1.1%.
GED/Equivalency Correlation Summary
| Measurement | Polish | South African |
| Minimum | 71.1% | 72.7% |
| Maximum | 100.0% | 100.0% |
| Range | 28.9% | 27.3% |
| Mean | 89.8% | 91.5% |
| Median | 89.8% | 90.4% |
| Interquartile 25% (IQ1) | 87.5% | 87.9% |
| Interquartile 75% (IQ3) | 91.5% | 97.6% |
| Interquartile Range (IQR) | 4.1% | 9.7% |
| Standard Deviation (Sample) | 5.8% | 6.5% |
| Standard Deviation (Population) | 5.8% | 6.4% |
Similar Demographics by GED/Equivalency
Demographics Similar to Poles by GED/Equivalency
In terms of ged/equivalency, the demographic groups most similar to Poles are Turkish (88.5%, a difference of 0.020%), Immigrants from Northern Europe (88.5%, a difference of 0.030%), Bhutanese (88.4%, a difference of 0.050%), Immigrants from Lithuania (88.6%, a difference of 0.070%), and Danish (88.4%, a difference of 0.070%).
| Demographics | Rating | Rank | GED/Equivalency |
| Immigrants | Ireland | 99.8 /100 | #22 | Exceptional 88.6% |
| Russians | 99.8 /100 | #23 | Exceptional 88.6% |
| Slovaks | 99.8 /100 | #24 | Exceptional 88.6% |
| Estonians | 99.8 /100 | #25 | Exceptional 88.6% |
| Immigrants | Australia | 99.8 /100 | #26 | Exceptional 88.6% |
| Immigrants | Lithuania | 99.8 /100 | #27 | Exceptional 88.6% |
| Immigrants | Northern Europe | 99.8 /100 | #28 | Exceptional 88.5% |
| Poles | 99.8 /100 | #29 | Exceptional 88.5% |
| Turks | 99.8 /100 | #30 | Exceptional 88.5% |
| Bhutanese | 99.8 /100 | #31 | Exceptional 88.4% |
| Danes | 99.8 /100 | #32 | Exceptional 88.4% |
| Immigrants | Sweden | 99.7 /100 | #33 | Exceptional 88.4% |
| Immigrants | Japan | 99.7 /100 | #34 | Exceptional 88.4% |
| Immigrants | South Central Asia | 99.7 /100 | #35 | Exceptional 88.4% |
| Immigrants | Belgium | 99.7 /100 | #36 | Exceptional 88.3% |
Demographics Similar to South Africans by GED/Equivalency
In terms of ged/equivalency, the demographic groups most similar to South Africans are Immigrants from Sri Lanka (87.5%, a difference of 0.010%), Romanian (87.5%, a difference of 0.010%), Immigrants from Romania (87.5%, a difference of 0.040%), Dutch (87.5%, a difference of 0.040%), and Immigrants from England (87.6%, a difference of 0.050%).
| Demographics | Rating | Rank | GED/Equivalency |
| Immigrants | Serbia | 98.7 /100 | #76 | Exceptional 87.7% |
| Slavs | 98.7 /100 | #77 | Exceptional 87.7% |
| Irish | 98.6 /100 | #78 | Exceptional 87.6% |
| English | 98.6 /100 | #79 | Exceptional 87.6% |
| Immigrants | England | 98.5 /100 | #80 | Exceptional 87.6% |
| Immigrants | Sri Lanka | 98.3 /100 | #81 | Exceptional 87.5% |
| Romanians | 98.3 /100 | #82 | Exceptional 87.5% |
| South Africans | 98.3 /100 | #83 | Exceptional 87.5% |
| Immigrants | Romania | 98.1 /100 | #84 | Exceptional 87.5% |
| Dutch | 98.1 /100 | #85 | Exceptional 87.5% |
| Immigrants | Europe | 98.1 /100 | #86 | Exceptional 87.5% |
| Native Hawaiians | 98.1 /100 | #87 | Exceptional 87.5% |
| Immigrants | Norway | 98.1 /100 | #88 | Exceptional 87.5% |
| Hungarians | 97.9 /100 | #89 | Exceptional 87.4% |
| Welsh | 97.9 /100 | #90 | Exceptional 87.4% |