South African vs Immigrants from Kuwait 7th Grade
COMPARE
South African
Immigrants from Kuwait
7th Grade
7th Grade Comparison
South Africans
Immigrants from Kuwait
96.6%
7TH GRADE
98.0/ 100
METRIC RATING
105th/ 347
METRIC RANK
96.4%
7TH GRADE
91.1/ 100
METRIC RATING
135th/ 347
METRIC RANK
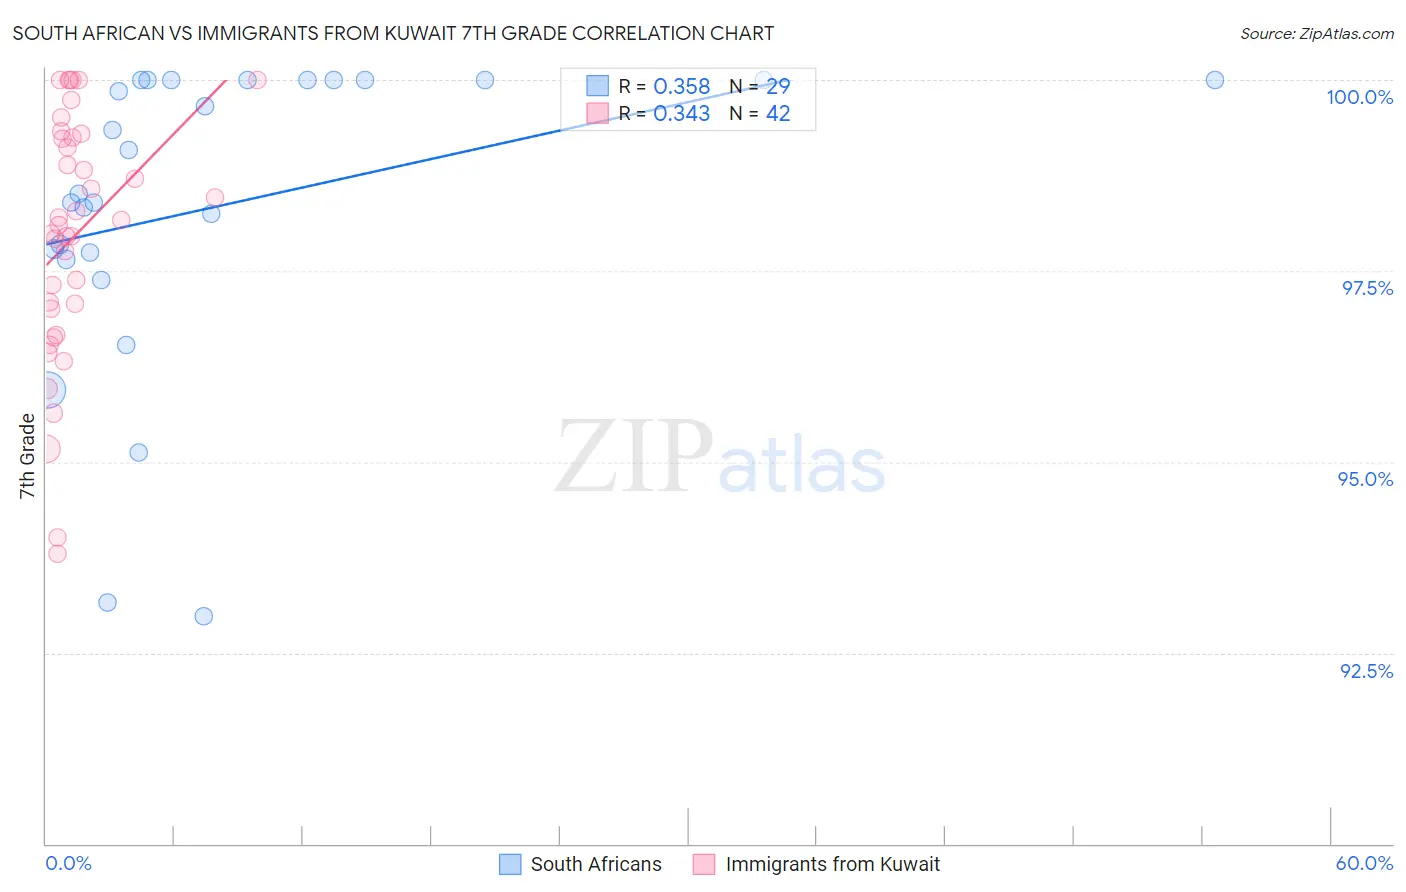
South African vs Immigrants from Kuwait 7th Grade Correlation Chart
The statistical analysis conducted on geographies consisting of 182,604,532 people shows a mild positive correlation between the proportion of South Africans and percentage of population with at least 7th grade education in the United States with a correlation coefficient (R) of 0.358 and weighted average of 96.6%. Similarly, the statistical analysis conducted on geographies consisting of 136,913,666 people shows a mild positive correlation between the proportion of Immigrants from Kuwait and percentage of population with at least 7th grade education in the United States with a correlation coefficient (R) of 0.343 and weighted average of 96.4%, a difference of 0.24%.
7th Grade Correlation Summary
| Measurement | South African | Immigrants from Kuwait |
| Minimum | 93.0% | 93.8% |
| Maximum | 100.0% | 100.0% |
| Range | 7.0% | 6.2% |
| Mean | 98.3% | 98.0% |
| Median | 98.5% | 98.1% |
| Interquartile 25% (IQ1) | 97.7% | 97.0% |
| Interquartile 75% (IQ3) | 100.0% | 99.2% |
| Interquartile Range (IQR) | 2.3% | 2.2% |
| Standard Deviation (Sample) | 2.0% | 1.6% |
| Standard Deviation (Population) | 2.0% | 1.6% |
Similar Demographics by 7th Grade
Demographics Similar to South Africans by 7th Grade
In terms of 7th grade, the demographic groups most similar to South Africans are Shoshone (96.6%, a difference of 0.010%), Iroquois (96.6%, a difference of 0.010%), Immigrants from Singapore (96.6%, a difference of 0.020%), Lumbee (96.6%, a difference of 0.020%), and Immigrants from Saudi Arabia (96.6%, a difference of 0.020%).
| Demographics | Rating | Rank | 7th Grade |
| Immigrants | Sweden | 98.7 /100 | #98 | Exceptional 96.7% |
| Menominee | 98.7 /100 | #99 | Exceptional 96.7% |
| German Russians | 98.6 /100 | #100 | Exceptional 96.7% |
| Thais | 98.6 /100 | #101 | Exceptional 96.7% |
| Immigrants | Czechoslovakia | 98.3 /100 | #102 | Exceptional 96.6% |
| Immigrants | Singapore | 98.3 /100 | #103 | Exceptional 96.6% |
| Shoshone | 98.1 /100 | #104 | Exceptional 96.6% |
| South Africans | 98.0 /100 | #105 | Exceptional 96.6% |
| Iroquois | 97.9 /100 | #106 | Exceptional 96.6% |
| Lumbee | 97.8 /100 | #107 | Exceptional 96.6% |
| Immigrants | Saudi Arabia | 97.8 /100 | #108 | Exceptional 96.6% |
| Bhutanese | 97.7 /100 | #109 | Exceptional 96.6% |
| Okinawans | 97.4 /100 | #110 | Exceptional 96.6% |
| Immigrants | Latvia | 97.4 /100 | #111 | Exceptional 96.6% |
| Immigrants | Nonimmigrants | 97.0 /100 | #112 | Exceptional 96.5% |
Demographics Similar to Immigrants from Kuwait by 7th Grade
In terms of 7th grade, the demographic groups most similar to Immigrants from Kuwait are Soviet Union (96.4%, a difference of 0.0%), Colville (96.4%, a difference of 0.010%), Hmong (96.4%, a difference of 0.010%), Immigrants from Hungary (96.4%, a difference of 0.010%), and Filipino (96.4%, a difference of 0.020%).
| Demographics | Rating | Rank | 7th Grade |
| Immigrants | Romania | 93.2 /100 | #128 | Exceptional 96.4% |
| Immigrants | North Macedonia | 93.1 /100 | #129 | Exceptional 96.4% |
| Immigrants | Serbia | 92.8 /100 | #130 | Exceptional 96.4% |
| Filipinos | 92.1 /100 | #131 | Exceptional 96.4% |
| Colville | 91.7 /100 | #132 | Exceptional 96.4% |
| Hmong | 91.5 /100 | #133 | Exceptional 96.4% |
| Soviet Union | 91.2 /100 | #134 | Exceptional 96.4% |
| Immigrants | Kuwait | 91.1 /100 | #135 | Exceptional 96.4% |
| Immigrants | Hungary | 90.6 /100 | #136 | Exceptional 96.4% |
| Immigrants | Turkey | 90.2 /100 | #137 | Exceptional 96.4% |
| Jordanians | 90.0 /100 | #138 | Excellent 96.4% |
| Basques | 89.3 /100 | #139 | Excellent 96.4% |
| Cambodians | 88.3 /100 | #140 | Excellent 96.3% |
| Immigrants | South Central Asia | 87.1 /100 | #141 | Excellent 96.3% |
| Burmese | 87.1 /100 | #142 | Excellent 96.3% |