Immigrants from Poland vs Serbian 2nd Grade
COMPARE
Immigrants from Poland
Serbian
2nd Grade
2nd Grade Comparison
Immigrants from Poland
Serbians
97.8%
2ND GRADE
42.2/ 100
METRIC RATING
183rd/ 347
METRIC RANK
98.3%
2ND GRADE
99.6/ 100
METRIC RATING
70th/ 347
METRIC RANK
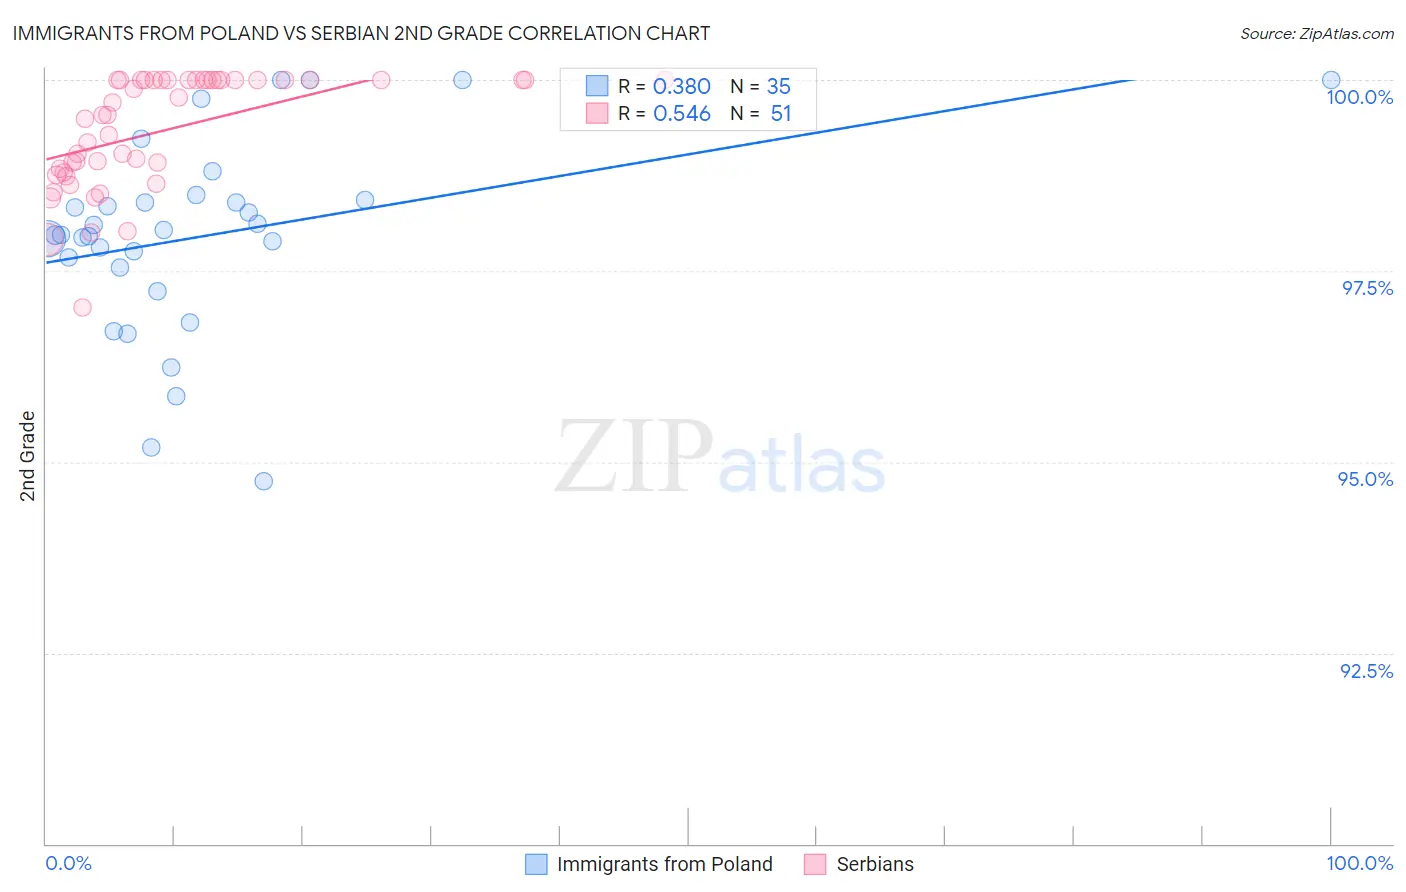
Immigrants from Poland vs Serbian 2nd Grade Correlation Chart
The statistical analysis conducted on geographies consisting of 304,861,559 people shows a mild positive correlation between the proportion of Immigrants from Poland and percentage of population with at least 2nd grade education in the United States with a correlation coefficient (R) of 0.380 and weighted average of 97.8%. Similarly, the statistical analysis conducted on geographies consisting of 267,642,942 people shows a substantial positive correlation between the proportion of Serbians and percentage of population with at least 2nd grade education in the United States with a correlation coefficient (R) of 0.546 and weighted average of 98.3%, a difference of 0.47%.
2nd Grade Correlation Summary
| Measurement | Immigrants from Poland | Serbian |
| Minimum | 94.8% | 97.0% |
| Maximum | 100.0% | 100.0% |
| Range | 5.2% | 3.0% |
| Mean | 98.0% | 99.3% |
| Median | 98.0% | 99.5% |
| Interquartile 25% (IQ1) | 97.5% | 98.8% |
| Interquartile 75% (IQ3) | 98.4% | 100.0% |
| Interquartile Range (IQR) | 0.89% | 1.2% |
| Standard Deviation (Sample) | 1.3% | 0.74% |
| Standard Deviation (Population) | 1.2% | 0.73% |
Similar Demographics by 2nd Grade
Demographics Similar to Immigrants from Poland by 2nd Grade
In terms of 2nd grade, the demographic groups most similar to Immigrants from Poland are Portuguese (97.8%, a difference of 0.0%), Immigrants from Belarus (97.8%, a difference of 0.0%), Immigrants from Brazil (97.9%, a difference of 0.010%), Argentinean (97.9%, a difference of 0.010%), and Immigrants from Venezuela (97.9%, a difference of 0.010%).
| Demographics | Rating | Rank | 2nd Grade |
| Immigrants | Sri Lanka | 48.7 /100 | #176 | Average 97.9% |
| Immigrants | Brazil | 46.6 /100 | #177 | Average 97.9% |
| Argentineans | 46.3 /100 | #178 | Average 97.9% |
| Immigrants | Venezuela | 46.1 /100 | #179 | Average 97.9% |
| Natives/Alaskans | 44.3 /100 | #180 | Average 97.9% |
| Egyptians | 44.3 /100 | #181 | Average 97.9% |
| Portuguese | 42.4 /100 | #182 | Average 97.8% |
| Immigrants | Poland | 42.2 /100 | #183 | Average 97.8% |
| Immigrants | Belarus | 41.5 /100 | #184 | Average 97.8% |
| Immigrants | Argentina | 40.6 /100 | #185 | Average 97.8% |
| Arabs | 36.9 /100 | #186 | Fair 97.8% |
| Pakistanis | 36.1 /100 | #187 | Fair 97.8% |
| Immigrants | Kazakhstan | 35.6 /100 | #188 | Fair 97.8% |
| Panamanians | 33.5 /100 | #189 | Fair 97.8% |
| Immigrants | Taiwan | 31.8 /100 | #190 | Fair 97.8% |
Demographics Similar to Serbians by 2nd Grade
In terms of 2nd grade, the demographic groups most similar to Serbians are Immigrants from Northern Europe (98.3%, a difference of 0.0%), Russian (98.3%, a difference of 0.0%), Immigrants from Austria (98.3%, a difference of 0.0%), Chickasaw (98.3%, a difference of 0.0%), and Canadian (98.3%, a difference of 0.010%).
| Demographics | Rating | Rank | 2nd Grade |
| Maltese | 99.7 /100 | #63 | Exceptional 98.3% |
| Immigrants | North America | 99.7 /100 | #64 | Exceptional 98.3% |
| New Zealanders | 99.7 /100 | #65 | Exceptional 98.3% |
| Canadians | 99.7 /100 | #66 | Exceptional 98.3% |
| Immigrants | Northern Europe | 99.7 /100 | #67 | Exceptional 98.3% |
| Russians | 99.7 /100 | #68 | Exceptional 98.3% |
| Immigrants | Austria | 99.6 /100 | #69 | Exceptional 98.3% |
| Serbians | 99.6 /100 | #70 | Exceptional 98.3% |
| Chickasaw | 99.6 /100 | #71 | Exceptional 98.3% |
| Cheyenne | 99.6 /100 | #72 | Exceptional 98.3% |
| Cajuns | 99.5 /100 | #73 | Exceptional 98.3% |
| Immigrants | Netherlands | 99.4 /100 | #74 | Exceptional 98.3% |
| Shoshone | 99.4 /100 | #75 | Exceptional 98.3% |
| Cherokee | 99.4 /100 | #76 | Exceptional 98.3% |
| Immigrants | England | 99.4 /100 | #77 | Exceptional 98.3% |