Immigrants from Somalia vs Immigrants from Guyana 5th Grade
COMPARE
Immigrants from Somalia
Immigrants from Guyana
5th Grade
5th Grade Comparison
Immigrants from Somalia
Immigrants from Guyana
96.4%
5TH GRADE
0.0/ 100
METRIC RATING
295th/ 347
METRIC RANK
96.0%
5TH GRADE
0.0/ 100
METRIC RATING
309th/ 347
METRIC RANK
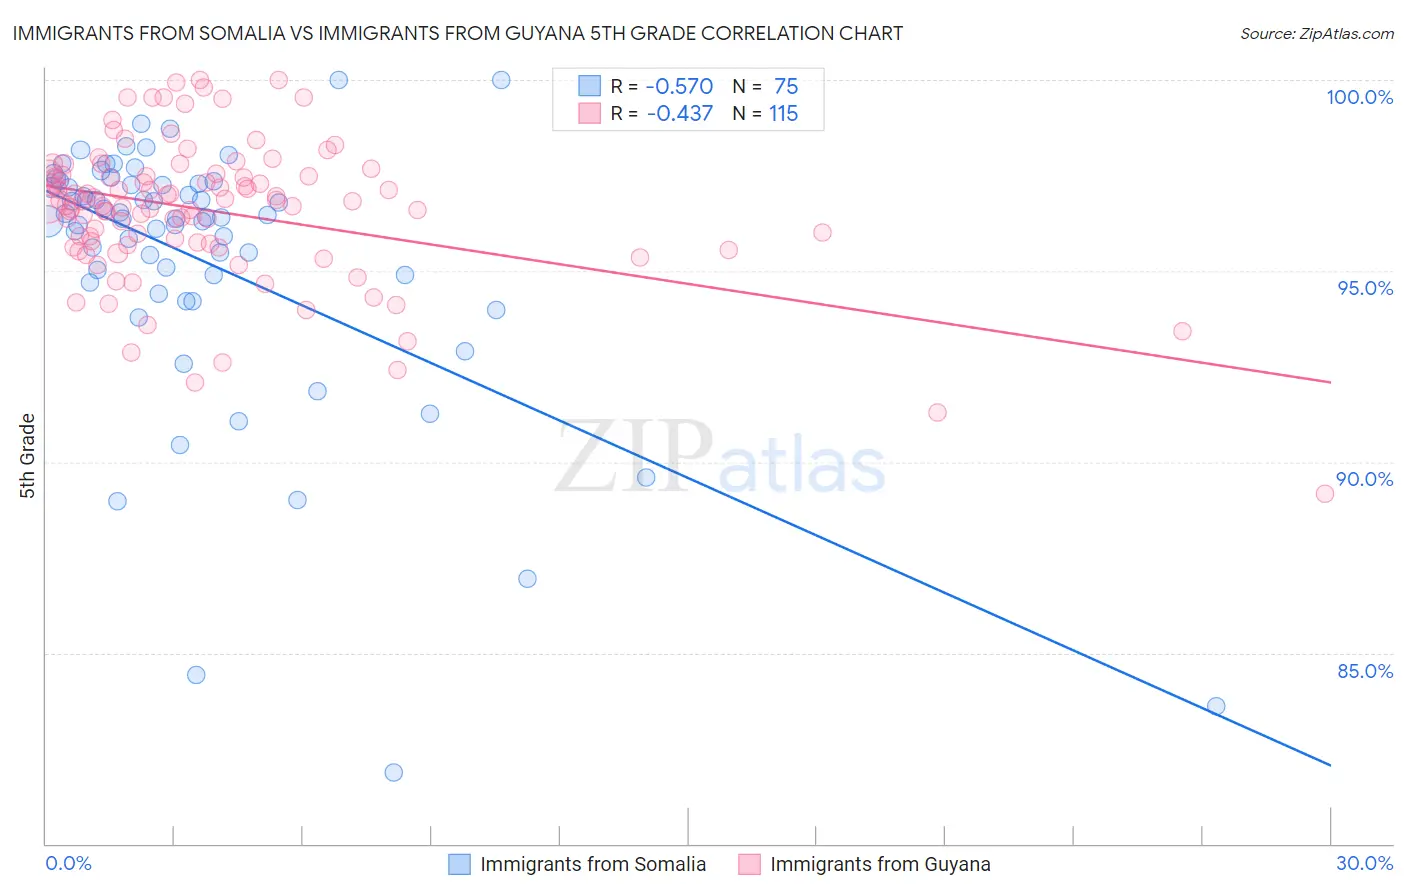
Immigrants from Somalia vs Immigrants from Guyana 5th Grade Correlation Chart
The statistical analysis conducted on geographies consisting of 92,109,166 people shows a substantial negative correlation between the proportion of Immigrants from Somalia and percentage of population with at least 5th grade education in the United States with a correlation coefficient (R) of -0.570 and weighted average of 96.4%. Similarly, the statistical analysis conducted on geographies consisting of 183,673,461 people shows a moderate negative correlation between the proportion of Immigrants from Guyana and percentage of population with at least 5th grade education in the United States with a correlation coefficient (R) of -0.437 and weighted average of 96.0%, a difference of 0.38%.
5th Grade Correlation Summary
| Measurement | Immigrants from Somalia | Immigrants from Guyana |
| Minimum | 81.9% | 89.2% |
| Maximum | 100.0% | 100.0% |
| Range | 18.1% | 10.8% |
| Mean | 95.3% | 96.6% |
| Median | 96.4% | 96.7% |
| Interquartile 25% (IQ1) | 94.7% | 95.7% |
| Interquartile 75% (IQ3) | 97.3% | 97.5% |
| Interquartile Range (IQR) | 2.6% | 1.9% |
| Standard Deviation (Sample) | 3.5% | 1.9% |
| Standard Deviation (Population) | 3.5% | 1.9% |
Demographics Similar to Immigrants from Somalia and Immigrants from Guyana by 5th Grade
In terms of 5th grade, the demographic groups most similar to Immigrants from Somalia are Immigrants from Eritrea (96.4%, a difference of 0.040%), Immigrants from Grenada (96.5%, a difference of 0.080%), Somali (96.5%, a difference of 0.090%), Immigrants from South Eastern Asia (96.3%, a difference of 0.10%), and Haitian (96.3%, a difference of 0.13%). Similarly, the demographic groups most similar to Immigrants from Guyana are Ecuadorian (96.0%, a difference of 0.010%), Immigrants from Haiti (96.0%, a difference of 0.020%), Immigrants from Caribbean (96.0%, a difference of 0.020%), Immigrants from Laos (96.0%, a difference of 0.030%), and Indonesian (96.0%, a difference of 0.040%).
| Demographics | Rating | Rank | 5th Grade |
| Somalis | 0.0 /100 | #292 | Tragic 96.5% |
| Immigrants | Grenada | 0.0 /100 | #293 | Tragic 96.5% |
| Immigrants | Eritrea | 0.0 /100 | #294 | Tragic 96.4% |
| Immigrants | Somalia | 0.0 /100 | #295 | Tragic 96.4% |
| Immigrants | South Eastern Asia | 0.0 /100 | #296 | Tragic 96.3% |
| Haitians | 0.0 /100 | #297 | Tragic 96.3% |
| Immigrants | Dominica | 0.0 /100 | #298 | Tragic 96.2% |
| Immigrants | Immigrants | 0.0 /100 | #299 | Tragic 96.2% |
| Sri Lankans | 0.0 /100 | #300 | Tragic 96.1% |
| Immigrants | Cuba | 0.0 /100 | #301 | Tragic 96.1% |
| Guyanese | 0.0 /100 | #302 | Tragic 96.1% |
| Puerto Ricans | 0.0 /100 | #303 | Tragic 96.1% |
| Immigrants | Burma/Myanmar | 0.0 /100 | #304 | Tragic 96.1% |
| Immigrants | Laos | 0.0 /100 | #305 | Tragic 96.0% |
| Immigrants | Haiti | 0.0 /100 | #306 | Tragic 96.0% |
| Immigrants | Caribbean | 0.0 /100 | #307 | Tragic 96.0% |
| Ecuadorians | 0.0 /100 | #308 | Tragic 96.0% |
| Immigrants | Guyana | 0.0 /100 | #309 | Tragic 96.0% |
| Indonesians | 0.0 /100 | #310 | Tragic 96.0% |
| Immigrants | Bangladesh | 0.0 /100 | #311 | Tragic 96.0% |
| Vietnamese | 0.0 /100 | #312 | Tragic 95.9% |