Pennsylvania German vs Immigrants from Malaysia 6th Grade
COMPARE
Pennsylvania German
Immigrants from Malaysia
6th Grade
6th Grade Comparison
Pennsylvania Germans
Immigrants from Malaysia
98.1%
6TH GRADE
100.0/ 100
METRIC RATING
18th/ 347
METRIC RANK
96.7%
6TH GRADE
4.0/ 100
METRIC RATING
228th/ 347
METRIC RANK
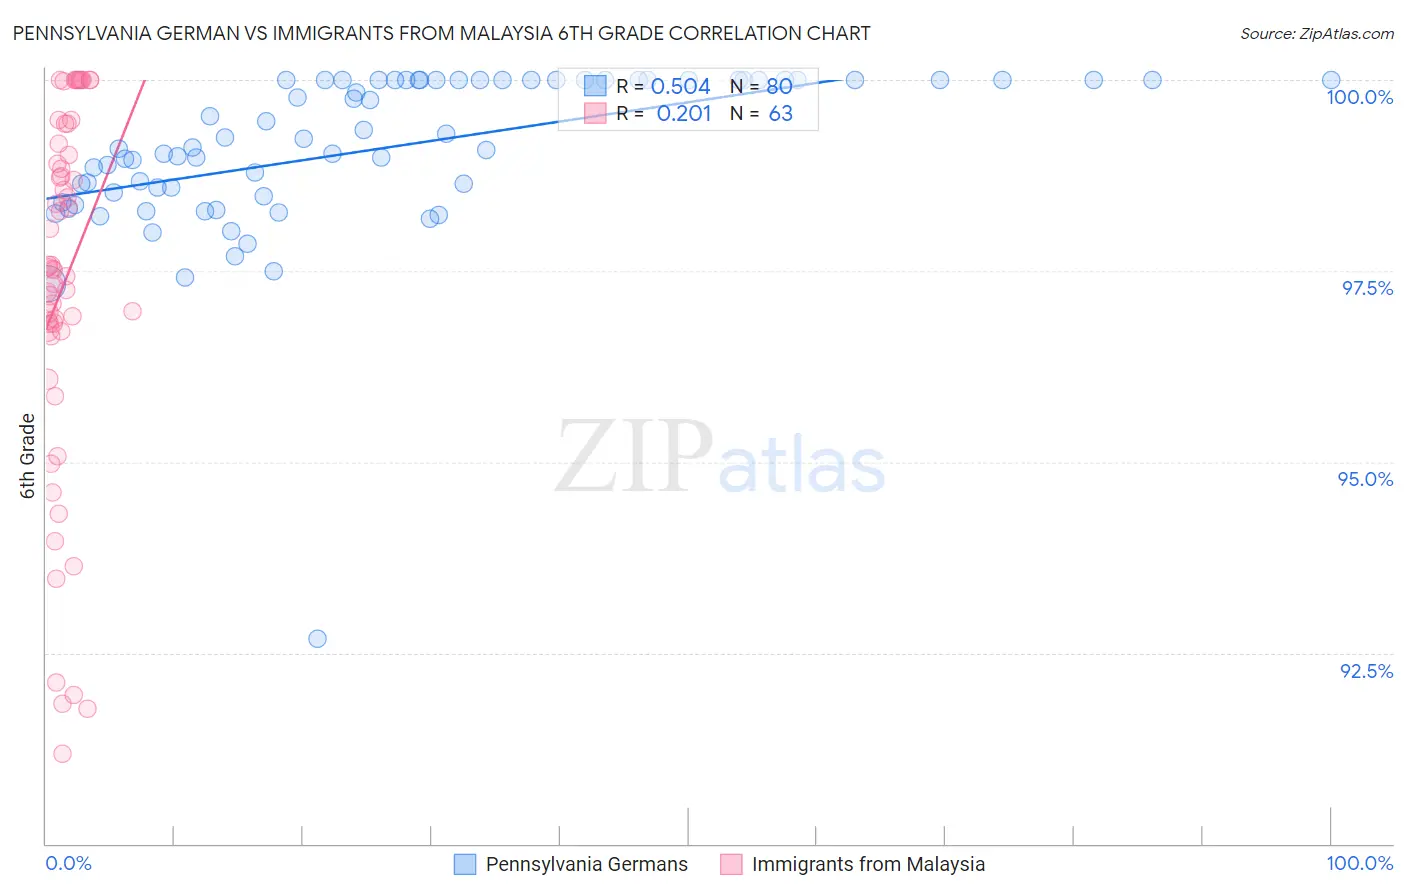
Pennsylvania German vs Immigrants from Malaysia 6th Grade Correlation Chart
The statistical analysis conducted on geographies consisting of 234,102,531 people shows a substantial positive correlation between the proportion of Pennsylvania Germans and percentage of population with at least 6th grade education in the United States with a correlation coefficient (R) of 0.504 and weighted average of 98.1%. Similarly, the statistical analysis conducted on geographies consisting of 197,973,709 people shows a weak positive correlation between the proportion of Immigrants from Malaysia and percentage of population with at least 6th grade education in the United States with a correlation coefficient (R) of 0.201 and weighted average of 96.7%, a difference of 1.5%.
6th Grade Correlation Summary
| Measurement | Pennsylvania German | Immigrants from Malaysia |
| Minimum | 92.7% | 91.2% |
| Maximum | 100.0% | 100.0% |
| Range | 7.3% | 8.8% |
| Mean | 99.1% | 97.3% |
| Median | 99.2% | 97.5% |
| Interquartile 25% (IQ1) | 98.5% | 96.7% |
| Interquartile 75% (IQ3) | 100.0% | 99.2% |
| Interquartile Range (IQR) | 1.5% | 2.5% |
| Standard Deviation (Sample) | 1.1% | 2.4% |
| Standard Deviation (Population) | 1.1% | 2.4% |
Similar Demographics by 6th Grade
Demographics Similar to Pennsylvania Germans by 6th Grade
In terms of 6th grade, the demographic groups most similar to Pennsylvania Germans are Polish (98.1%, a difference of 0.0%), Scottish (98.1%, a difference of 0.010%), Irish (98.1%, a difference of 0.010%), Carpatho Rusyn (98.1%, a difference of 0.020%), and Inupiat (98.1%, a difference of 0.020%).
| Demographics | Rating | Rank | 6th Grade |
| English | 100.0 /100 | #11 | Exceptional 98.1% |
| Alaskan Athabascans | 100.0 /100 | #12 | Exceptional 98.1% |
| Tlingit-Haida | 100.0 /100 | #13 | Exceptional 98.1% |
| Carpatho Rusyns | 100.0 /100 | #14 | Exceptional 98.1% |
| Inupiat | 100.0 /100 | #15 | Exceptional 98.1% |
| Scottish | 100.0 /100 | #16 | Exceptional 98.1% |
| Poles | 100.0 /100 | #17 | Exceptional 98.1% |
| Pennsylvania Germans | 100.0 /100 | #18 | Exceptional 98.1% |
| Irish | 100.0 /100 | #19 | Exceptional 98.1% |
| Finns | 100.0 /100 | #20 | Exceptional 98.1% |
| Lithuanians | 100.0 /100 | #21 | Exceptional 98.1% |
| Danes | 100.0 /100 | #22 | Exceptional 98.0% |
| Sioux | 100.0 /100 | #23 | Exceptional 98.0% |
| Croatians | 100.0 /100 | #24 | Exceptional 98.0% |
| Scotch-Irish | 100.0 /100 | #25 | Exceptional 98.0% |
Demographics Similar to Immigrants from Malaysia by 6th Grade
In terms of 6th grade, the demographic groups most similar to Immigrants from Malaysia are Immigrants from Panama (96.7%, a difference of 0.0%), Immigrants from Western Asia (96.7%, a difference of 0.0%), Assyrian/Chaldean/Syriac (96.7%, a difference of 0.0%), Immigrants from Eastern Asia (96.7%, a difference of 0.0%), and Immigrants from Southern Europe (96.7%, a difference of 0.010%).
| Demographics | Rating | Rank | 6th Grade |
| Tongans | 6.1 /100 | #221 | Tragic 96.7% |
| Immigrants | Syria | 5.9 /100 | #222 | Tragic 96.7% |
| Bahamians | 4.8 /100 | #223 | Tragic 96.7% |
| Immigrants | Southern Europe | 4.4 /100 | #224 | Tragic 96.7% |
| Immigrants | Pakistan | 4.4 /100 | #225 | Tragic 96.7% |
| Immigrants | Panama | 4.2 /100 | #226 | Tragic 96.7% |
| Immigrants | Western Asia | 4.1 /100 | #227 | Tragic 96.7% |
| Immigrants | Malaysia | 4.0 /100 | #228 | Tragic 96.7% |
| Assyrians/Chaldeans/Syriacs | 4.0 /100 | #229 | Tragic 96.7% |
| Immigrants | Eastern Asia | 4.0 /100 | #230 | Tragic 96.7% |
| Sub-Saharan Africans | 3.5 /100 | #231 | Tragic 96.7% |
| South American Indians | 3.5 /100 | #232 | Tragic 96.7% |
| Yuman | 3.2 /100 | #233 | Tragic 96.7% |
| Uruguayans | 2.5 /100 | #234 | Tragic 96.6% |
| Asians | 2.4 /100 | #235 | Tragic 96.6% |