Belgian vs Immigrants from Malaysia 6th Grade
COMPARE
Belgian
Immigrants from Malaysia
6th Grade
6th Grade Comparison
Belgians
Immigrants from Malaysia
97.9%
6TH GRADE
100.0/ 100
METRIC RATING
38th/ 347
METRIC RANK
96.7%
6TH GRADE
4.0/ 100
METRIC RATING
228th/ 347
METRIC RANK
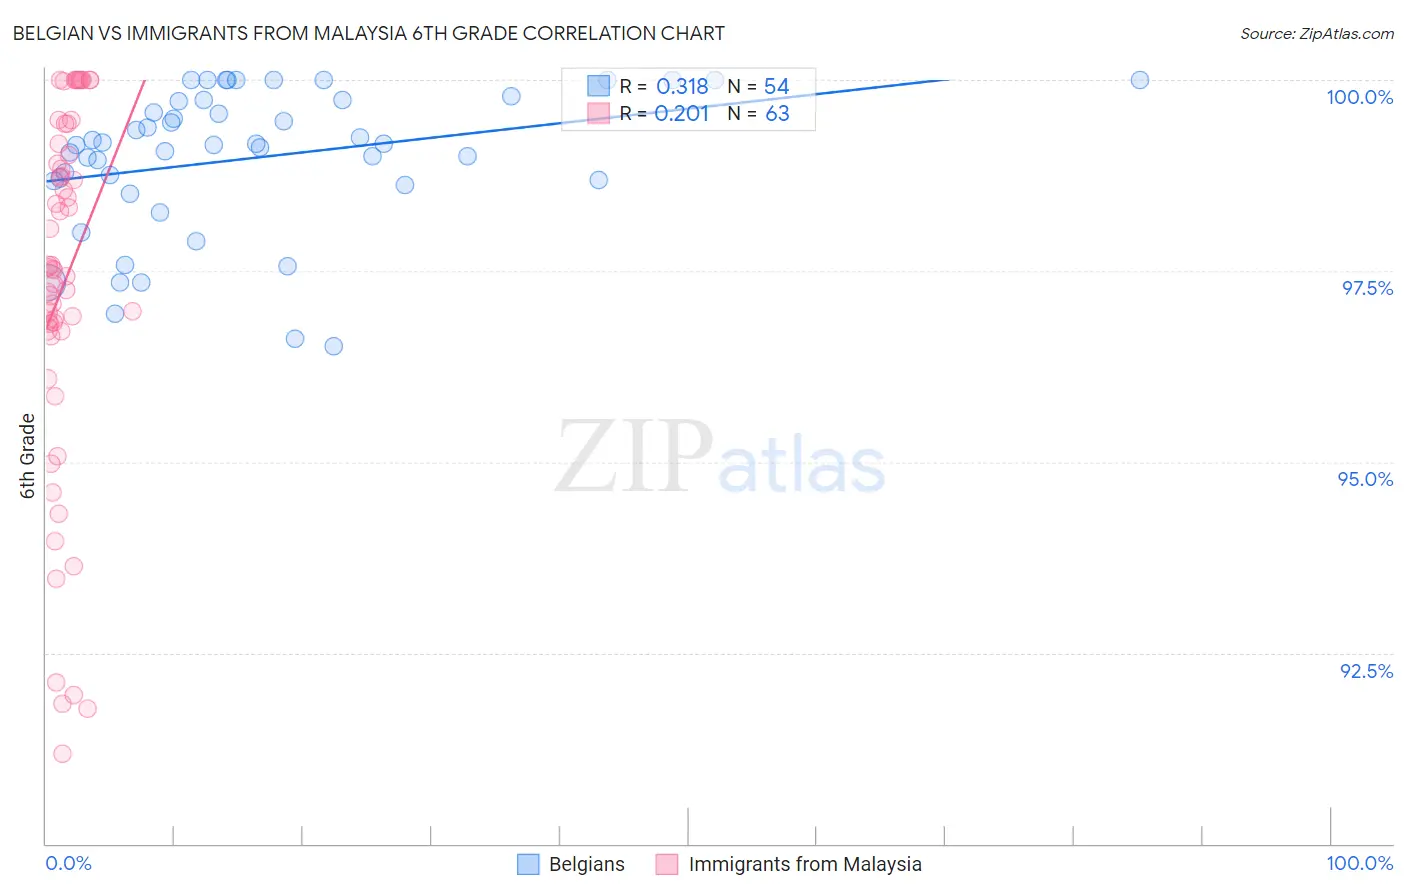
Belgian vs Immigrants from Malaysia 6th Grade Correlation Chart
The statistical analysis conducted on geographies consisting of 356,016,627 people shows a mild positive correlation between the proportion of Belgians and percentage of population with at least 6th grade education in the United States with a correlation coefficient (R) of 0.318 and weighted average of 97.9%. Similarly, the statistical analysis conducted on geographies consisting of 197,973,709 people shows a weak positive correlation between the proportion of Immigrants from Malaysia and percentage of population with at least 6th grade education in the United States with a correlation coefficient (R) of 0.201 and weighted average of 96.7%, a difference of 1.2%.
6th Grade Correlation Summary
| Measurement | Belgian | Immigrants from Malaysia |
| Minimum | 96.5% | 91.2% |
| Maximum | 100.0% | 100.0% |
| Range | 3.5% | 8.8% |
| Mean | 99.0% | 97.3% |
| Median | 99.2% | 97.5% |
| Interquartile 25% (IQ1) | 98.7% | 96.7% |
| Interquartile 75% (IQ3) | 99.7% | 99.2% |
| Interquartile Range (IQR) | 1.1% | 2.5% |
| Standard Deviation (Sample) | 0.94% | 2.4% |
| Standard Deviation (Population) | 0.93% | 2.4% |
Similar Demographics by 6th Grade
Demographics Similar to Belgians by 6th Grade
In terms of 6th grade, the demographic groups most similar to Belgians are Luxembourger (97.9%, a difference of 0.0%), Latvian (97.9%, a difference of 0.010%), Italian (97.9%, a difference of 0.020%), British (97.9%, a difference of 0.020%), and Chinese (97.9%, a difference of 0.030%).
| Demographics | Rating | Rank | 6th Grade |
| Europeans | 100.0 /100 | #31 | Exceptional 98.0% |
| Alaska Natives | 100.0 /100 | #32 | Exceptional 98.0% |
| Chippewa | 100.0 /100 | #33 | Exceptional 97.9% |
| Swiss | 100.0 /100 | #34 | Exceptional 97.9% |
| Chinese | 100.0 /100 | #35 | Exceptional 97.9% |
| Italians | 100.0 /100 | #36 | Exceptional 97.9% |
| British | 100.0 /100 | #37 | Exceptional 97.9% |
| Belgians | 100.0 /100 | #38 | Exceptional 97.9% |
| Luxembourgers | 99.9 /100 | #39 | Exceptional 97.9% |
| Latvians | 99.9 /100 | #40 | Exceptional 97.9% |
| Eastern Europeans | 99.9 /100 | #41 | Exceptional 97.9% |
| Hungarians | 99.9 /100 | #42 | Exceptional 97.8% |
| Northern Europeans | 99.9 /100 | #43 | Exceptional 97.8% |
| Czechoslovakians | 99.9 /100 | #44 | Exceptional 97.8% |
| Bulgarians | 99.9 /100 | #45 | Exceptional 97.8% |
Demographics Similar to Immigrants from Malaysia by 6th Grade
In terms of 6th grade, the demographic groups most similar to Immigrants from Malaysia are Immigrants from Panama (96.7%, a difference of 0.0%), Immigrants from Western Asia (96.7%, a difference of 0.0%), Assyrian/Chaldean/Syriac (96.7%, a difference of 0.0%), Immigrants from Eastern Asia (96.7%, a difference of 0.0%), and Immigrants from Southern Europe (96.7%, a difference of 0.010%).
| Demographics | Rating | Rank | 6th Grade |
| Tongans | 6.1 /100 | #221 | Tragic 96.7% |
| Immigrants | Syria | 5.9 /100 | #222 | Tragic 96.7% |
| Bahamians | 4.8 /100 | #223 | Tragic 96.7% |
| Immigrants | Southern Europe | 4.4 /100 | #224 | Tragic 96.7% |
| Immigrants | Pakistan | 4.4 /100 | #225 | Tragic 96.7% |
| Immigrants | Panama | 4.2 /100 | #226 | Tragic 96.7% |
| Immigrants | Western Asia | 4.1 /100 | #227 | Tragic 96.7% |
| Immigrants | Malaysia | 4.0 /100 | #228 | Tragic 96.7% |
| Assyrians/Chaldeans/Syriacs | 4.0 /100 | #229 | Tragic 96.7% |
| Immigrants | Eastern Asia | 4.0 /100 | #230 | Tragic 96.7% |
| Sub-Saharan Africans | 3.5 /100 | #231 | Tragic 96.7% |
| South American Indians | 3.5 /100 | #232 | Tragic 96.7% |
| Yuman | 3.2 /100 | #233 | Tragic 96.7% |
| Uruguayans | 2.5 /100 | #234 | Tragic 96.6% |
| Asians | 2.4 /100 | #235 | Tragic 96.6% |