Pennsylvania German vs Yup'ik No Schooling Completed
COMPARE
Pennsylvania German
Yup'ik
No Schooling Completed
No Schooling Completed Comparison
Pennsylvania Germans
Yup'ik
1.5%
NO SCHOOLING COMPLETED
100.0/ 100
METRIC RATING
24th/ 347
METRIC RANK
1.2%
NO SCHOOLING COMPLETED
100.0/ 100
METRIC RATING
1st/ 347
METRIC RANK
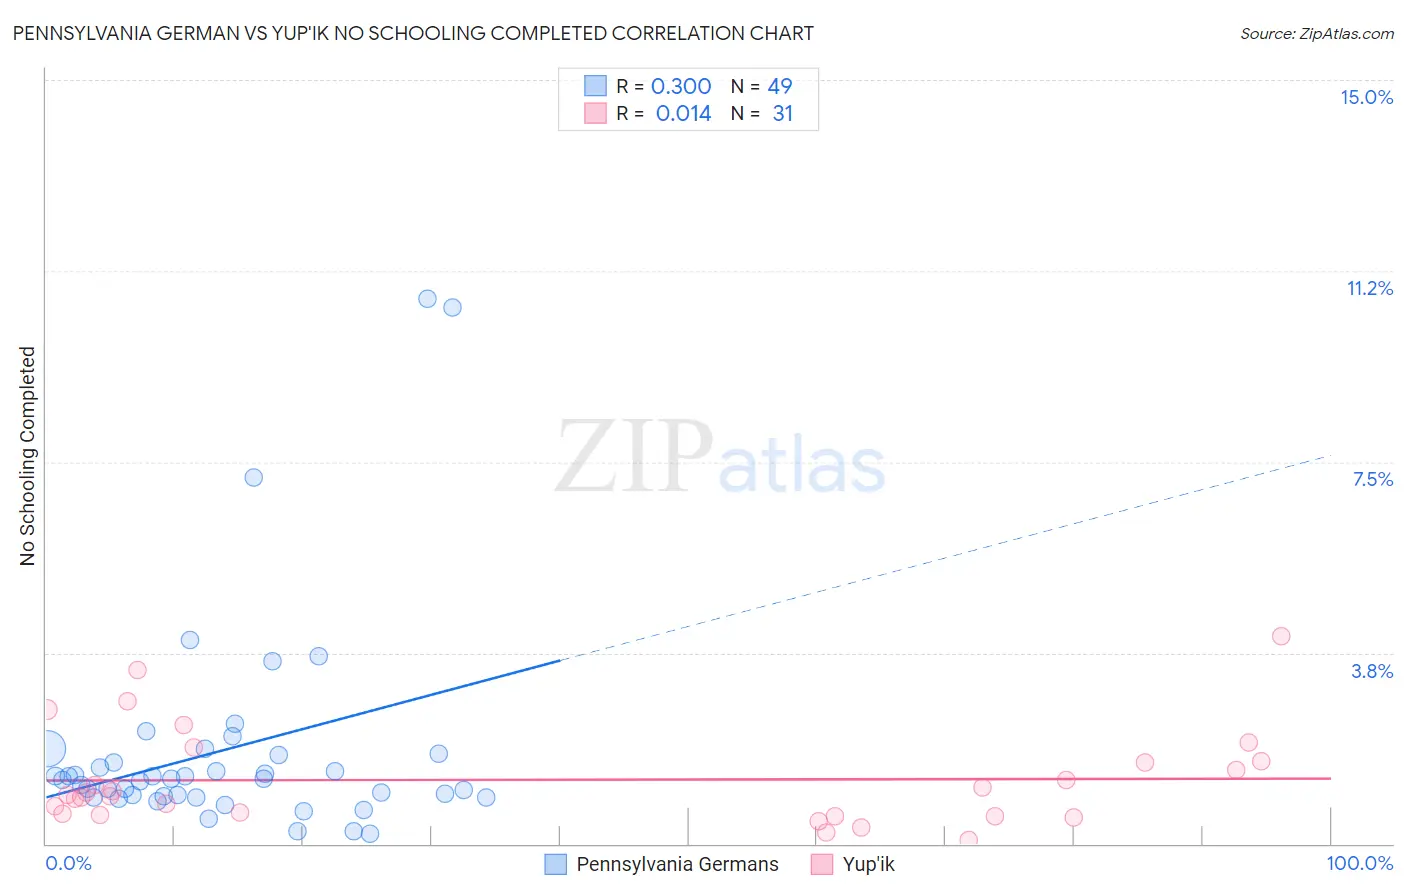
Pennsylvania German vs Yup'ik No Schooling Completed Correlation Chart
The statistical analysis conducted on geographies consisting of 231,584,755 people shows a mild positive correlation between the proportion of Pennsylvania Germans and percentage of population with no schooling in the United States with a correlation coefficient (R) of 0.300 and weighted average of 1.5%. Similarly, the statistical analysis conducted on geographies consisting of 39,712,568 people shows no correlation between the proportion of Yup'ik and percentage of population with no schooling in the United States with a correlation coefficient (R) of 0.014 and weighted average of 1.2%, a difference of 20.6%.
No Schooling Completed Correlation Summary
| Measurement | Pennsylvania German | Yup'ik |
| Minimum | 0.19% | 0.071% |
| Maximum | 10.7% | 4.1% |
| Range | 10.5% | 4.0% |
| Mean | 1.8% | 1.3% |
| Median | 1.3% | 0.95% |
| Interquartile 25% (IQ1) | 0.92% | 0.55% |
| Interquartile 75% (IQ3) | 1.8% | 1.6% |
| Interquartile Range (IQR) | 0.83% | 1.1% |
| Standard Deviation (Sample) | 2.2% | 0.95% |
| Standard Deviation (Population) | 2.1% | 0.94% |
Similar Demographics by No Schooling Completed
Demographics Similar to Pennsylvania Germans by No Schooling Completed
In terms of no schooling completed, the demographic groups most similar to Pennsylvania Germans are French (1.5%, a difference of 0.020%), European (1.5%, a difference of 0.35%), Alaska Native (1.5%, a difference of 0.61%), Czech (1.5%, a difference of 0.61%), and Chinese (1.5%, a difference of 0.70%).
| Demographics | Rating | Rank | No Schooling Completed |
| Croatians | 100.0 /100 | #17 | Exceptional 1.5% |
| Danes | 100.0 /100 | #18 | Exceptional 1.5% |
| Alaskan Athabascans | 100.0 /100 | #19 | Exceptional 1.5% |
| Welsh | 100.0 /100 | #20 | Exceptional 1.5% |
| Chinese | 100.0 /100 | #21 | Exceptional 1.5% |
| Alaska Natives | 100.0 /100 | #22 | Exceptional 1.5% |
| Europeans | 100.0 /100 | #23 | Exceptional 1.5% |
| Pennsylvania Germans | 100.0 /100 | #24 | Exceptional 1.5% |
| French | 100.0 /100 | #25 | Exceptional 1.5% |
| Czechs | 100.0 /100 | #26 | Exceptional 1.5% |
| Scandinavians | 100.0 /100 | #27 | Exceptional 1.5% |
| French Canadians | 100.0 /100 | #28 | Exceptional 1.5% |
| Lumbee | 100.0 /100 | #29 | Exceptional 1.5% |
| British | 100.0 /100 | #30 | Exceptional 1.5% |
| Inupiat | 100.0 /100 | #31 | Exceptional 1.5% |
Demographics Similar to Yup'ik by No Schooling Completed
In terms of no schooling completed, the demographic groups most similar to Yup'ik are Slovak (1.3%, a difference of 9.1%), Norwegian (1.3%, a difference of 9.6%), German (1.4%, a difference of 10.2%), Slovene (1.4%, a difference of 10.7%), and Carpatho Rusyn (1.4%, a difference of 11.6%).
| Demographics | Rating | Rank | No Schooling Completed |
| Yup'ik | 100.0 /100 | #1 | Exceptional 1.2% |
| Slovaks | 100.0 /100 | #2 | Exceptional 1.3% |
| Norwegians | 100.0 /100 | #3 | Exceptional 1.3% |
| Germans | 100.0 /100 | #4 | Exceptional 1.4% |
| Slovenes | 100.0 /100 | #5 | Exceptional 1.4% |
| Carpatho Rusyns | 100.0 /100 | #6 | Exceptional 1.4% |
| English | 100.0 /100 | #7 | Exceptional 1.4% |
| Swedes | 100.0 /100 | #8 | Exceptional 1.4% |
| Scottish | 100.0 /100 | #9 | Exceptional 1.4% |
| Dutch | 100.0 /100 | #10 | Exceptional 1.4% |
| Lithuanians | 100.0 /100 | #11 | Exceptional 1.4% |
| Irish | 100.0 /100 | #12 | Exceptional 1.4% |
| Poles | 100.0 /100 | #13 | Exceptional 1.4% |
| Scotch-Irish | 100.0 /100 | #14 | Exceptional 1.5% |
| Tlingit-Haida | 100.0 /100 | #15 | Exceptional 1.5% |