Paraguayan vs Immigrants from Venezuela Master's Degree
COMPARE
Paraguayan
Immigrants from Venezuela
Master's Degree
Master's Degree Comparison
Paraguayans
Immigrants from Venezuela
18.8%
MASTER'S DEGREE
100.0/ 100
METRIC RATING
48th/ 347
METRIC RANK
15.7%
MASTER'S DEGREE
83.6/ 100
METRIC RATING
143rd/ 347
METRIC RANK
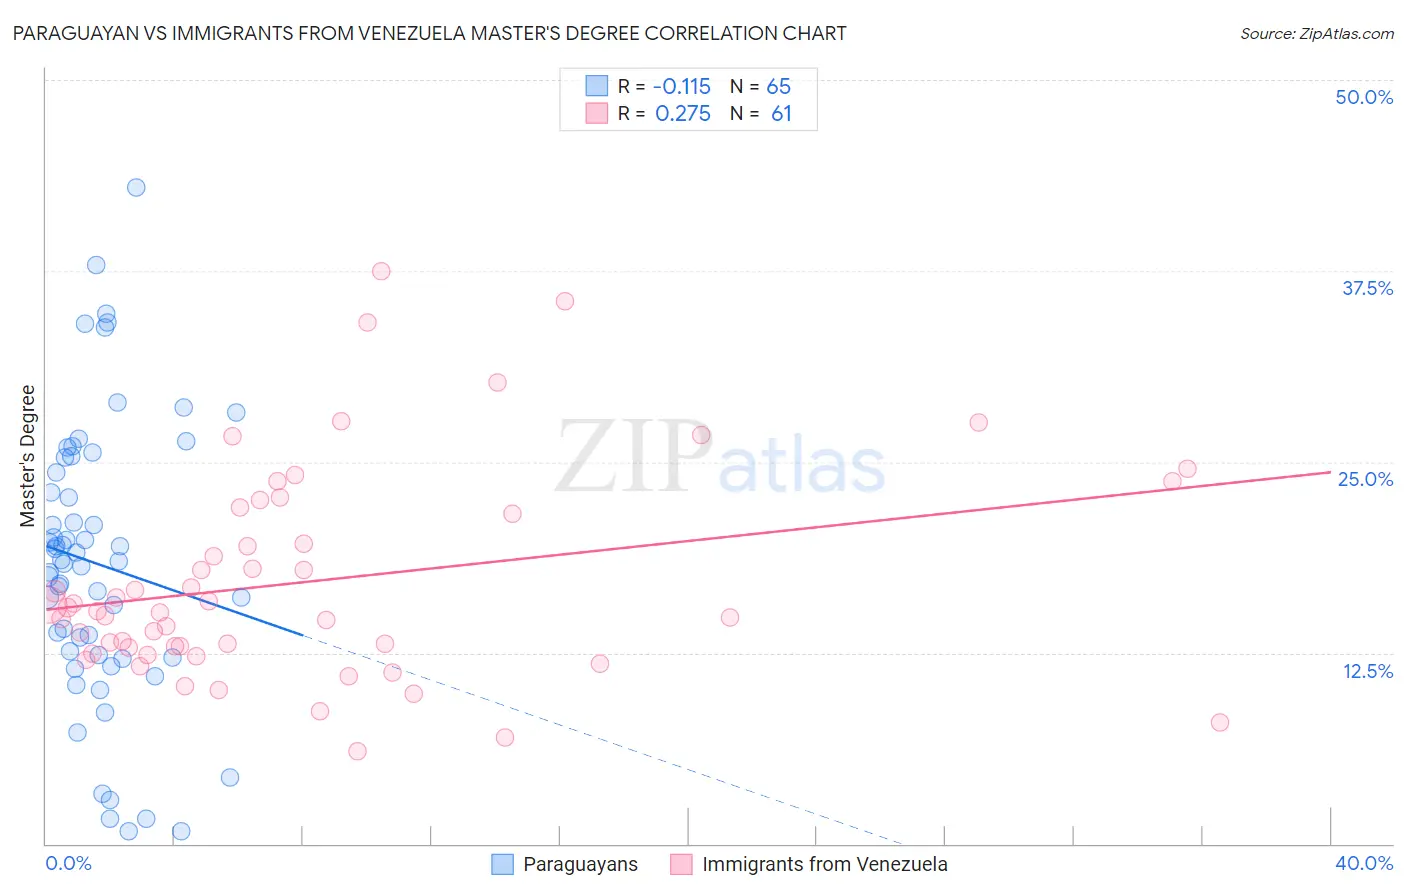
Paraguayan vs Immigrants from Venezuela Master's Degree Correlation Chart
The statistical analysis conducted on geographies consisting of 95,082,006 people shows a poor negative correlation between the proportion of Paraguayans and percentage of population with at least master's degree education in the United States with a correlation coefficient (R) of -0.115 and weighted average of 18.8%. Similarly, the statistical analysis conducted on geographies consisting of 287,820,434 people shows a weak positive correlation between the proportion of Immigrants from Venezuela and percentage of population with at least master's degree education in the United States with a correlation coefficient (R) of 0.275 and weighted average of 15.7%, a difference of 19.8%.
Master's Degree Correlation Summary
| Measurement | Paraguayan | Immigrants from Venezuela |
| Minimum | 0.82% | 6.1% |
| Maximum | 42.9% | 37.5% |
| Range | 42.1% | 31.4% |
| Mean | 18.3% | 17.2% |
| Median | 18.5% | 15.3% |
| Interquartile 25% (IQ1) | 12.3% | 12.6% |
| Interquartile 75% (IQ3) | 24.8% | 21.8% |
| Interquartile Range (IQR) | 12.5% | 9.2% |
| Standard Deviation (Sample) | 9.2% | 6.9% |
| Standard Deviation (Population) | 9.1% | 6.9% |
Similar Demographics by Master's Degree
Demographics Similar to Paraguayans by Master's Degree
In terms of master's degree, the demographic groups most similar to Paraguayans are Immigrants from Austria (18.8%, a difference of 0.060%), Immigrants from Norway (18.8%, a difference of 0.070%), Estonian (18.8%, a difference of 0.10%), Bulgarian (18.8%, a difference of 0.28%), and Immigrants from South Africa (18.8%, a difference of 0.30%).
| Demographics | Rating | Rank | Master's Degree |
| Immigrants | Latvia | 100.0 /100 | #41 | Exceptional 19.1% |
| Immigrants | Saudi Arabia | 100.0 /100 | #42 | Exceptional 19.0% |
| Immigrants | Greece | 100.0 /100 | #43 | Exceptional 19.0% |
| Immigrants | Malaysia | 100.0 /100 | #44 | Exceptional 18.9% |
| Immigrants | Belarus | 100.0 /100 | #45 | Exceptional 18.9% |
| Immigrants | Norway | 100.0 /100 | #46 | Exceptional 18.8% |
| Immigrants | Austria | 100.0 /100 | #47 | Exceptional 18.8% |
| Paraguayans | 100.0 /100 | #48 | Exceptional 18.8% |
| Estonians | 100.0 /100 | #49 | Exceptional 18.8% |
| Bulgarians | 100.0 /100 | #50 | Exceptional 18.8% |
| Immigrants | South Africa | 100.0 /100 | #51 | Exceptional 18.8% |
| Immigrants | Kuwait | 100.0 /100 | #52 | Exceptional 18.6% |
| Immigrants | Czechoslovakia | 99.9 /100 | #53 | Exceptional 18.5% |
| Immigrants | Lithuania | 99.9 /100 | #54 | Exceptional 18.5% |
| Immigrants | Serbia | 99.9 /100 | #55 | Exceptional 18.5% |
Demographics Similar to Immigrants from Venezuela by Master's Degree
In terms of master's degree, the demographic groups most similar to Immigrants from Venezuela are Canadian (15.7%, a difference of 0.080%), Immigrants from Africa (15.7%, a difference of 0.090%), Polish (15.7%, a difference of 0.32%), Vietnamese (15.8%, a difference of 0.44%), and South American (15.6%, a difference of 0.50%).
| Demographics | Rating | Rank | Master's Degree |
| Assyrians/Chaldeans/Syriacs | 86.8 /100 | #136 | Excellent 15.8% |
| Europeans | 86.4 /100 | #137 | Excellent 15.8% |
| Pakistanis | 86.1 /100 | #138 | Excellent 15.8% |
| Immigrants | Germany | 85.9 /100 | #139 | Excellent 15.8% |
| Vietnamese | 85.5 /100 | #140 | Excellent 15.8% |
| Poles | 85.0 /100 | #141 | Excellent 15.7% |
| Immigrants | Africa | 84.0 /100 | #142 | Excellent 15.7% |
| Immigrants | Venezuela | 83.6 /100 | #143 | Excellent 15.7% |
| Canadians | 83.3 /100 | #144 | Excellent 15.7% |
| South Americans | 81.3 /100 | #145 | Excellent 15.6% |
| Immigrants | Afghanistan | 79.4 /100 | #146 | Good 15.6% |
| Hungarians | 79.1 /100 | #147 | Good 15.6% |
| Immigrants | Senegal | 78.2 /100 | #148 | Good 15.5% |
| Ghanaians | 78.2 /100 | #149 | Good 15.5% |
| Slovenes | 78.0 /100 | #150 | Good 15.5% |