Korean vs Immigrants from Venezuela Master's Degree
COMPARE
Korean
Immigrants from Venezuela
Master's Degree
Master's Degree Comparison
Koreans
Immigrants from Venezuela
14.0%
MASTER'S DEGREE
12.7/ 100
METRIC RATING
221st/ 347
METRIC RANK
15.7%
MASTER'S DEGREE
83.6/ 100
METRIC RATING
143rd/ 347
METRIC RANK
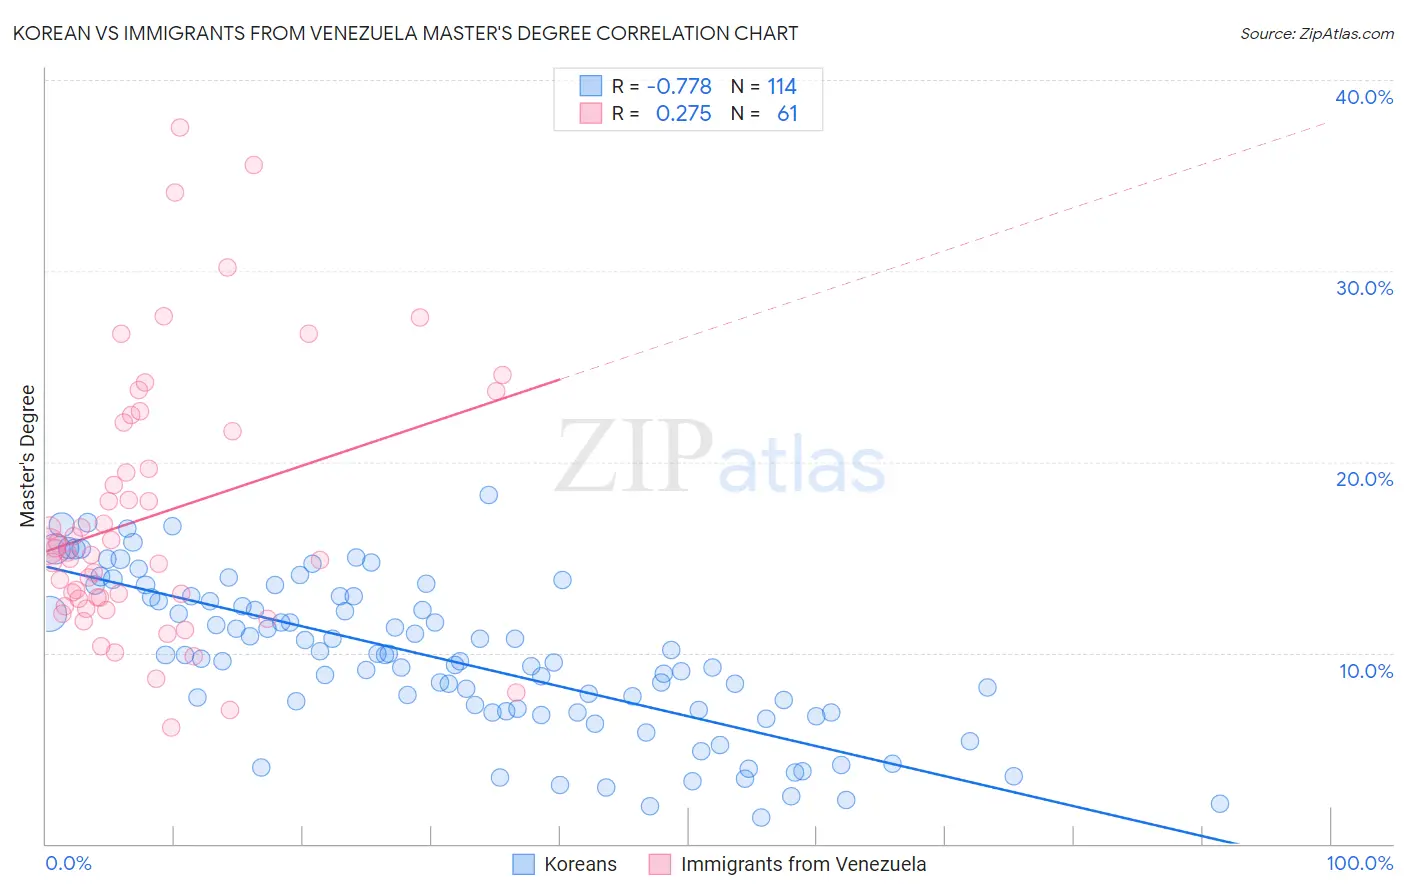
Korean vs Immigrants from Venezuela Master's Degree Correlation Chart
The statistical analysis conducted on geographies consisting of 510,607,877 people shows a strong negative correlation between the proportion of Koreans and percentage of population with at least master's degree education in the United States with a correlation coefficient (R) of -0.778 and weighted average of 14.0%. Similarly, the statistical analysis conducted on geographies consisting of 287,820,434 people shows a weak positive correlation between the proportion of Immigrants from Venezuela and percentage of population with at least master's degree education in the United States with a correlation coefficient (R) of 0.275 and weighted average of 15.7%, a difference of 12.1%.
Master's Degree Correlation Summary
| Measurement | Korean | Immigrants from Venezuela |
| Minimum | 1.4% | 6.1% |
| Maximum | 18.3% | 37.5% |
| Range | 16.9% | 31.4% |
| Mean | 9.7% | 17.2% |
| Median | 9.8% | 15.3% |
| Interquartile 25% (IQ1) | 6.9% | 12.6% |
| Interquartile 75% (IQ3) | 12.9% | 21.8% |
| Interquartile Range (IQR) | 6.0% | 9.2% |
| Standard Deviation (Sample) | 4.0% | 6.9% |
| Standard Deviation (Population) | 4.0% | 6.9% |
Similar Demographics by Master's Degree
Demographics Similar to Koreans by Master's Degree
In terms of master's degree, the demographic groups most similar to Koreans are Ecuadorian (14.0%, a difference of 0.030%), German (14.0%, a difference of 0.13%), Immigrants from South Eastern Asia (14.0%, a difference of 0.23%), Immigrants from Grenada (14.0%, a difference of 0.28%), and Norwegian (14.0%, a difference of 0.29%).
| Demographics | Rating | Rank | Master's Degree |
| Finns | 16.9 /100 | #214 | Poor 14.2% |
| Immigrants | Vietnam | 16.1 /100 | #215 | Poor 14.1% |
| Immigrants | Somalia | 15.8 /100 | #216 | Poor 14.1% |
| Immigrants | Trinidad and Tobago | 15.8 /100 | #217 | Poor 14.1% |
| French Canadians | 14.9 /100 | #218 | Poor 14.1% |
| Norwegians | 13.6 /100 | #219 | Poor 14.0% |
| Germans | 13.1 /100 | #220 | Poor 14.0% |
| Koreans | 12.7 /100 | #221 | Poor 14.0% |
| Ecuadorians | 12.6 /100 | #222 | Poor 14.0% |
| Immigrants | South Eastern Asia | 11.9 /100 | #223 | Poor 14.0% |
| Immigrants | Grenada | 11.8 /100 | #224 | Poor 14.0% |
| Portuguese | 11.2 /100 | #225 | Poor 13.9% |
| Immigrants | St. Vincent and the Grenadines | 11.0 /100 | #226 | Poor 13.9% |
| Immigrants | West Indies | 9.8 /100 | #227 | Tragic 13.9% |
| Whites/Caucasians | 9.1 /100 | #228 | Tragic 13.8% |
Demographics Similar to Immigrants from Venezuela by Master's Degree
In terms of master's degree, the demographic groups most similar to Immigrants from Venezuela are Canadian (15.7%, a difference of 0.080%), Immigrants from Africa (15.7%, a difference of 0.090%), Polish (15.7%, a difference of 0.32%), Vietnamese (15.8%, a difference of 0.44%), and South American (15.6%, a difference of 0.50%).
| Demographics | Rating | Rank | Master's Degree |
| Assyrians/Chaldeans/Syriacs | 86.8 /100 | #136 | Excellent 15.8% |
| Europeans | 86.4 /100 | #137 | Excellent 15.8% |
| Pakistanis | 86.1 /100 | #138 | Excellent 15.8% |
| Immigrants | Germany | 85.9 /100 | #139 | Excellent 15.8% |
| Vietnamese | 85.5 /100 | #140 | Excellent 15.8% |
| Poles | 85.0 /100 | #141 | Excellent 15.7% |
| Immigrants | Africa | 84.0 /100 | #142 | Excellent 15.7% |
| Immigrants | Venezuela | 83.6 /100 | #143 | Excellent 15.7% |
| Canadians | 83.3 /100 | #144 | Excellent 15.7% |
| South Americans | 81.3 /100 | #145 | Excellent 15.6% |
| Immigrants | Afghanistan | 79.4 /100 | #146 | Good 15.6% |
| Hungarians | 79.1 /100 | #147 | Good 15.6% |
| Immigrants | Senegal | 78.2 /100 | #148 | Good 15.5% |
| Ghanaians | 78.2 /100 | #149 | Good 15.5% |
| Slovenes | 78.0 /100 | #150 | Good 15.5% |