Panamanian vs Yaqui High School Diploma
COMPARE
Panamanian
Yaqui
High School Diploma
High School Diploma Comparison
Panamanians
Yaqui
88.6%
HIGH SCHOOL DIPLOMA
18.0/ 100
METRIC RATING
202nd/ 347
METRIC RANK
84.7%
HIGH SCHOOL DIPLOMA
0.0/ 100
METRIC RATING
314th/ 347
METRIC RANK
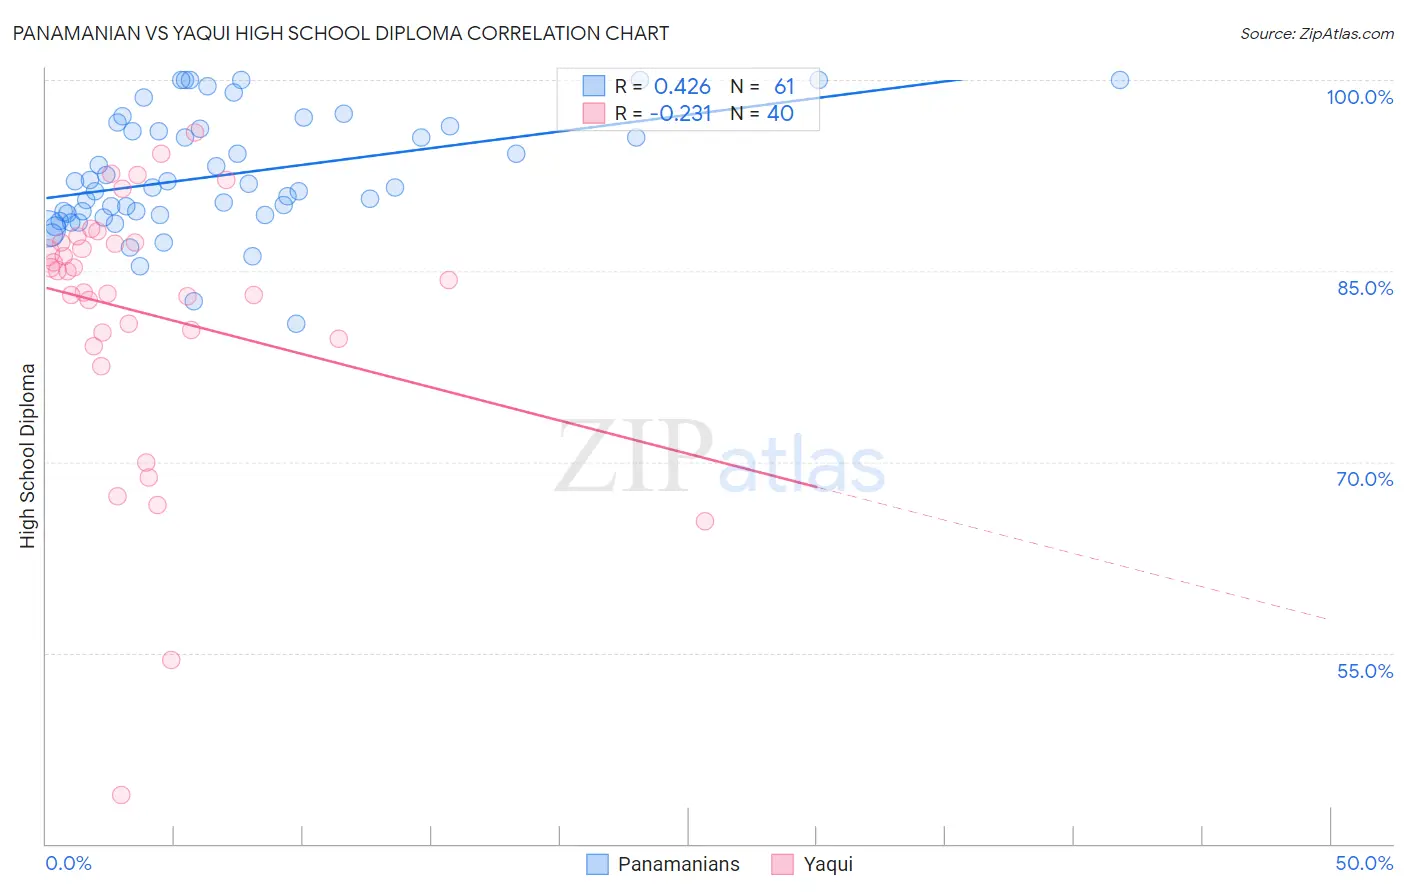
Panamanian vs Yaqui High School Diploma Correlation Chart
The statistical analysis conducted on geographies consisting of 281,248,649 people shows a moderate positive correlation between the proportion of Panamanians and percentage of population with at least high school diploma education in the United States with a correlation coefficient (R) of 0.426 and weighted average of 88.6%. Similarly, the statistical analysis conducted on geographies consisting of 107,732,380 people shows a weak negative correlation between the proportion of Yaqui and percentage of population with at least high school diploma education in the United States with a correlation coefficient (R) of -0.231 and weighted average of 84.7%, a difference of 4.6%.
High School Diploma Correlation Summary
| Measurement | Panamanian | Yaqui |
| Minimum | 80.9% | 43.8% |
| Maximum | 100.0% | 95.8% |
| Range | 19.1% | 52.1% |
| Mean | 92.6% | 81.7% |
| Median | 91.5% | 84.6% |
| Interquartile 25% (IQ1) | 89.4% | 79.9% |
| Interquartile 75% (IQ3) | 96.2% | 87.3% |
| Interquartile Range (IQR) | 6.8% | 7.3% |
| Standard Deviation (Sample) | 4.6% | 10.6% |
| Standard Deviation (Population) | 4.6% | 10.5% |
Similar Demographics by High School Diploma
Demographics Similar to Panamanians by High School Diploma
In terms of high school diploma, the demographic groups most similar to Panamanians are Korean (88.6%, a difference of 0.0%), Hawaiian (88.6%, a difference of 0.010%), Somali (88.6%, a difference of 0.010%), Liberian (88.7%, a difference of 0.020%), and Marshallese (88.6%, a difference of 0.020%).
| Demographics | Rating | Rank | High School Diploma |
| Afghans | 23.9 /100 | #195 | Fair 88.8% |
| Immigrants | Southern Europe | 23.4 /100 | #196 | Fair 88.7% |
| French American Indians | 21.5 /100 | #197 | Fair 88.7% |
| Liberians | 18.8 /100 | #198 | Poor 88.7% |
| Marshallese | 18.7 /100 | #199 | Poor 88.6% |
| Hawaiians | 18.3 /100 | #200 | Poor 88.6% |
| Koreans | 18.1 /100 | #201 | Poor 88.6% |
| Panamanians | 18.0 /100 | #202 | Poor 88.6% |
| Somalis | 17.5 /100 | #203 | Poor 88.6% |
| Armenians | 17.2 /100 | #204 | Poor 88.6% |
| Immigrants | Micronesia | 16.4 /100 | #205 | Poor 88.6% |
| Arapaho | 16.1 /100 | #206 | Poor 88.6% |
| Immigrants | Sierra Leone | 15.8 /100 | #207 | Poor 88.6% |
| Portuguese | 14.4 /100 | #208 | Poor 88.5% |
| Cherokee | 14.3 /100 | #209 | Poor 88.5% |
Demographics Similar to Yaqui by High School Diploma
In terms of high school diploma, the demographic groups most similar to Yaqui are Puerto Rican (84.7%, a difference of 0.10%), Immigrants from Ecuador (84.8%, a difference of 0.11%), Cape Verdean (85.1%, a difference of 0.37%), Ecuadorian (85.1%, a difference of 0.42%), and Apache (85.1%, a difference of 0.43%).
| Demographics | Rating | Rank | High School Diploma |
| Navajo | 0.0 /100 | #307 | Tragic 85.2% |
| Immigrants | Armenia | 0.0 /100 | #308 | Tragic 85.2% |
| Immigrants | Dominica | 0.0 /100 | #309 | Tragic 85.2% |
| Apache | 0.0 /100 | #310 | Tragic 85.1% |
| Ecuadorians | 0.0 /100 | #311 | Tragic 85.1% |
| Cape Verdeans | 0.0 /100 | #312 | Tragic 85.1% |
| Immigrants | Ecuador | 0.0 /100 | #313 | Tragic 84.8% |
| Yaqui | 0.0 /100 | #314 | Tragic 84.7% |
| Puerto Ricans | 0.0 /100 | #315 | Tragic 84.7% |
| Belizeans | 0.0 /100 | #316 | Tragic 84.3% |
| Immigrants | Caribbean | 0.0 /100 | #317 | Tragic 84.3% |
| Immigrants | Belize | 0.0 /100 | #318 | Tragic 84.2% |
| Central American Indians | 0.0 /100 | #319 | Tragic 84.2% |
| Nicaraguans | 0.0 /100 | #320 | Tragic 84.1% |
| Yuman | 0.0 /100 | #321 | Tragic 84.0% |