Palestinian vs Immigrants from Pakistan 2nd Grade
COMPARE
Palestinian
Immigrants from Pakistan
2nd Grade
2nd Grade Comparison
Palestinians
Immigrants from Pakistan
98.0%
2ND GRADE
83.9/ 100
METRIC RATING
140th/ 347
METRIC RANK
97.6%
2ND GRADE
2.3/ 100
METRIC RATING
231st/ 347
METRIC RANK
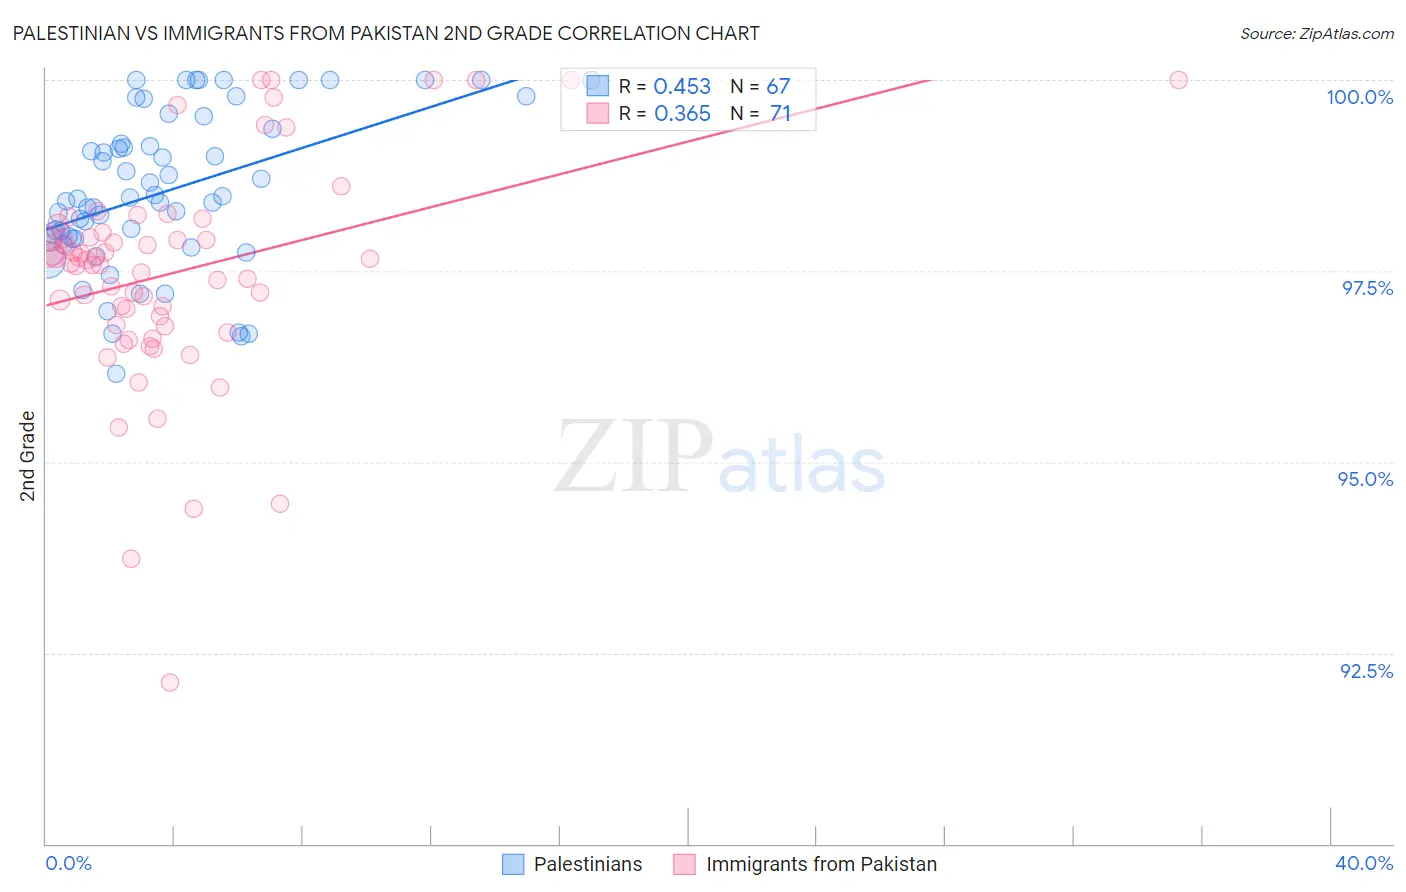
Palestinian vs Immigrants from Pakistan 2nd Grade Correlation Chart
The statistical analysis conducted on geographies consisting of 216,457,008 people shows a moderate positive correlation between the proportion of Palestinians and percentage of population with at least 2nd grade education in the United States with a correlation coefficient (R) of 0.453 and weighted average of 98.0%. Similarly, the statistical analysis conducted on geographies consisting of 283,900,935 people shows a mild positive correlation between the proportion of Immigrants from Pakistan and percentage of population with at least 2nd grade education in the United States with a correlation coefficient (R) of 0.365 and weighted average of 97.6%, a difference of 0.43%.
2nd Grade Correlation Summary
| Measurement | Palestinian | Immigrants from Pakistan |
| Minimum | 96.1% | 92.1% |
| Maximum | 100.0% | 100.0% |
| Range | 3.9% | 7.9% |
| Mean | 98.5% | 97.5% |
| Median | 98.4% | 97.6% |
| Interquartile 25% (IQ1) | 97.9% | 96.8% |
| Interquartile 75% (IQ3) | 99.4% | 98.0% |
| Interquartile Range (IQR) | 1.4% | 1.2% |
| Standard Deviation (Sample) | 1.0% | 1.4% |
| Standard Deviation (Population) | 1.0% | 1.4% |
Similar Demographics by 2nd Grade
Demographics Similar to Palestinians by 2nd Grade
In terms of 2nd grade, the demographic groups most similar to Palestinians are Immigrants from Turkey (98.0%, a difference of 0.010%), Blackfeet (98.0%, a difference of 0.020%), Burmese (98.0%, a difference of 0.020%), Alsatian (98.0%, a difference of 0.020%), and Hmong (98.0%, a difference of 0.020%).
| Demographics | Rating | Rank | 2nd Grade |
| Cambodians | 90.7 /100 | #133 | Exceptional 98.0% |
| Immigrants | Hungary | 89.7 /100 | #134 | Excellent 98.0% |
| Immigrants | Bulgaria | 89.7 /100 | #135 | Excellent 98.0% |
| Immigrants | Kuwait | 89.2 /100 | #136 | Excellent 98.0% |
| Immigrants | Romania | 88.3 /100 | #137 | Excellent 98.0% |
| Israelis | 87.9 /100 | #138 | Excellent 98.0% |
| Blackfeet | 87.5 /100 | #139 | Excellent 98.0% |
| Palestinians | 83.9 /100 | #140 | Excellent 98.0% |
| Immigrants | Turkey | 83.0 /100 | #141 | Excellent 98.0% |
| Burmese | 81.0 /100 | #142 | Excellent 98.0% |
| Alsatians | 80.5 /100 | #143 | Excellent 98.0% |
| Hmong | 80.0 /100 | #144 | Good 98.0% |
| Filipinos | 79.2 /100 | #145 | Good 98.0% |
| Immigrants | Israel | 78.0 /100 | #146 | Good 98.0% |
| Immigrants | Greece | 76.8 /100 | #147 | Good 98.0% |
Demographics Similar to Immigrants from Pakistan by 2nd Grade
In terms of 2nd grade, the demographic groups most similar to Immigrants from Pakistan are Immigrants from Western Asia (97.6%, a difference of 0.010%), Immigrants from Uruguay (97.6%, a difference of 0.010%), Immigrants from Malaysia (97.6%, a difference of 0.010%), Colombian (97.6%, a difference of 0.010%), and Immigrants from Costa Rica (97.6%, a difference of 0.020%).
| Demographics | Rating | Rank | 2nd Grade |
| Immigrants | Zaire | 4.3 /100 | #224 | Tragic 97.6% |
| Tongans | 4.3 /100 | #225 | Tragic 97.6% |
| Immigrants | Syria | 4.0 /100 | #226 | Tragic 97.6% |
| Immigrants | Nepal | 4.0 /100 | #227 | Tragic 97.6% |
| Sub-Saharan Africans | 3.4 /100 | #228 | Tragic 97.6% |
| Immigrants | Costa Rica | 3.1 /100 | #229 | Tragic 97.6% |
| Senegalese | 3.1 /100 | #230 | Tragic 97.6% |
| Immigrants | Pakistan | 2.3 /100 | #231 | Tragic 97.6% |
| Immigrants | Western Asia | 2.1 /100 | #232 | Tragic 97.6% |
| Immigrants | Uruguay | 2.1 /100 | #233 | Tragic 97.6% |
| Immigrants | Malaysia | 2.0 /100 | #234 | Tragic 97.6% |
| Colombians | 1.9 /100 | #235 | Tragic 97.6% |
| Nigerians | 1.7 /100 | #236 | Tragic 97.6% |
| U.S. Virgin Islanders | 1.6 /100 | #237 | Tragic 97.6% |
| Immigrants | Eastern Asia | 1.6 /100 | #238 | Tragic 97.6% |