Pakistani vs Uruguayan 2nd Grade
COMPARE
Pakistani
Uruguayan
2nd Grade
2nd Grade Comparison
Pakistanis
Uruguayans
97.8%
2ND GRADE
36.1/ 100
METRIC RATING
187th/ 347
METRIC RANK
97.7%
2ND GRADE
6.2/ 100
METRIC RATING
217th/ 347
METRIC RANK
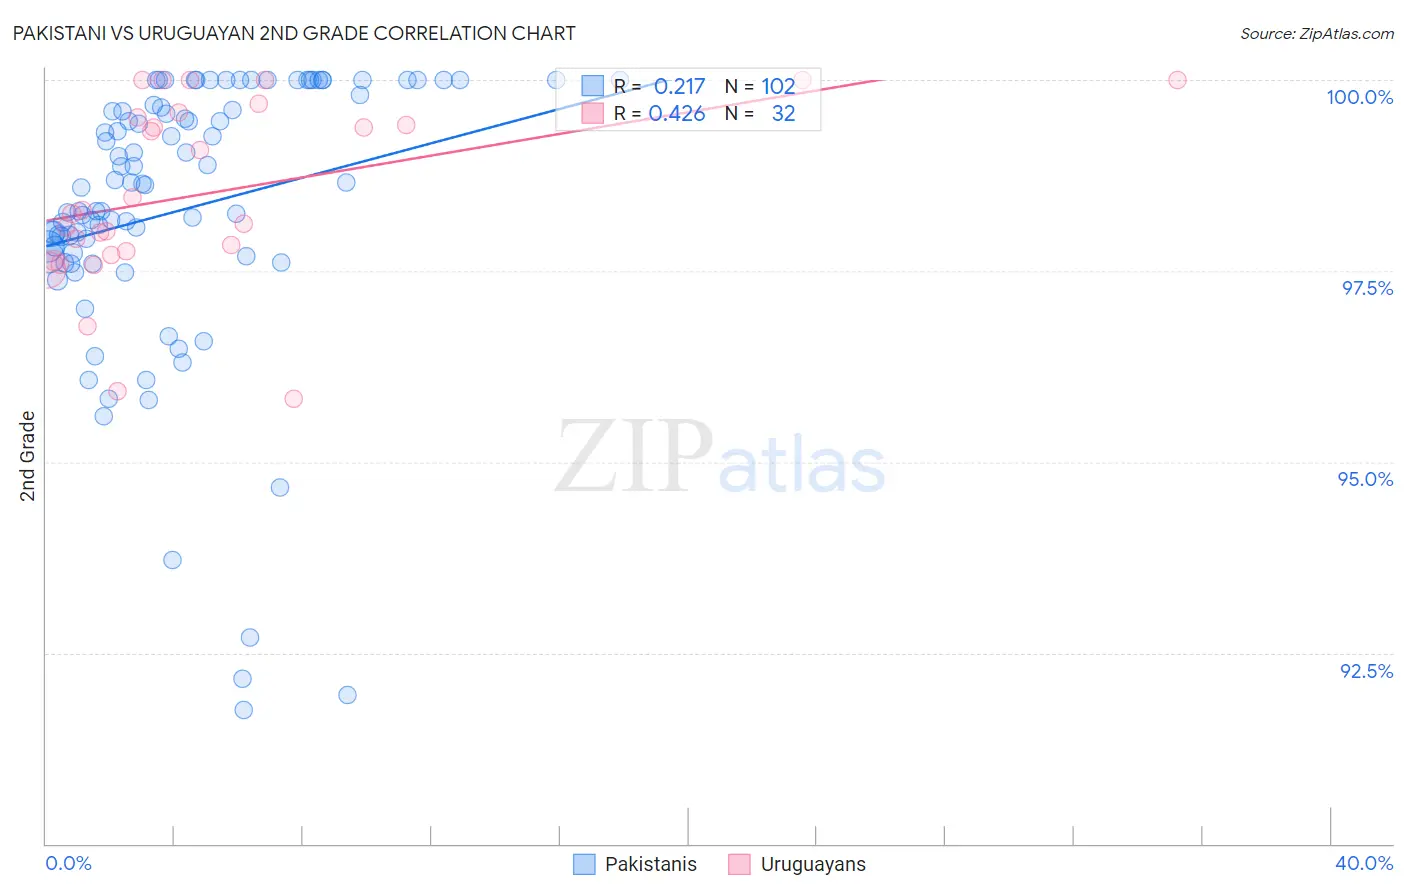
Pakistani vs Uruguayan 2nd Grade Correlation Chart
The statistical analysis conducted on geographies consisting of 335,355,426 people shows a weak positive correlation between the proportion of Pakistanis and percentage of population with at least 2nd grade education in the United States with a correlation coefficient (R) of 0.217 and weighted average of 97.8%. Similarly, the statistical analysis conducted on geographies consisting of 144,782,794 people shows a moderate positive correlation between the proportion of Uruguayans and percentage of population with at least 2nd grade education in the United States with a correlation coefficient (R) of 0.426 and weighted average of 97.7%, a difference of 0.17%.
2nd Grade Correlation Summary
| Measurement | Pakistani | Uruguayan |
| Minimum | 91.8% | 95.8% |
| Maximum | 100.0% | 100.0% |
| Range | 8.2% | 4.2% |
| Mean | 98.3% | 98.5% |
| Median | 98.6% | 98.3% |
| Interquartile 25% (IQ1) | 97.7% | 97.7% |
| Interquartile 75% (IQ3) | 99.7% | 99.5% |
| Interquartile Range (IQR) | 2.0% | 1.8% |
| Standard Deviation (Sample) | 1.8% | 1.2% |
| Standard Deviation (Population) | 1.8% | 1.2% |
Similar Demographics by 2nd Grade
Demographics Similar to Pakistanis by 2nd Grade
In terms of 2nd grade, the demographic groups most similar to Pakistanis are Arab (97.8%, a difference of 0.0%), Immigrants from Kazakhstan (97.8%, a difference of 0.0%), Panamanian (97.8%, a difference of 0.010%), Portuguese (97.8%, a difference of 0.020%), and Immigrants from Poland (97.8%, a difference of 0.020%).
| Demographics | Rating | Rank | 2nd Grade |
| Natives/Alaskans | 44.3 /100 | #180 | Average 97.9% |
| Egyptians | 44.3 /100 | #181 | Average 97.9% |
| Portuguese | 42.4 /100 | #182 | Average 97.8% |
| Immigrants | Poland | 42.2 /100 | #183 | Average 97.8% |
| Immigrants | Belarus | 41.5 /100 | #184 | Average 97.8% |
| Immigrants | Argentina | 40.6 /100 | #185 | Average 97.8% |
| Arabs | 36.9 /100 | #186 | Fair 97.8% |
| Pakistanis | 36.1 /100 | #187 | Fair 97.8% |
| Immigrants | Kazakhstan | 35.6 /100 | #188 | Fair 97.8% |
| Panamanians | 33.5 /100 | #189 | Fair 97.8% |
| Immigrants | Taiwan | 31.8 /100 | #190 | Fair 97.8% |
| Paraguayans | 30.8 /100 | #191 | Fair 97.8% |
| Blacks/African Americans | 29.9 /100 | #192 | Fair 97.8% |
| Hawaiians | 28.5 /100 | #193 | Fair 97.8% |
| Paiute | 27.0 /100 | #194 | Fair 97.8% |
Demographics Similar to Uruguayans by 2nd Grade
In terms of 2nd grade, the demographic groups most similar to Uruguayans are Samoan (97.7%, a difference of 0.010%), Bahamian (97.7%, a difference of 0.010%), South American Indian (97.7%, a difference of 0.010%), Sudanese (97.7%, a difference of 0.010%), and Moroccan (97.7%, a difference of 0.020%).
| Demographics | Rating | Rank | 2nd Grade |
| Costa Ricans | 10.5 /100 | #210 | Poor 97.7% |
| Laotians | 9.9 /100 | #211 | Tragic 97.7% |
| Immigrants | Bahamas | 8.4 /100 | #212 | Tragic 97.7% |
| Moroccans | 8.2 /100 | #213 | Tragic 97.7% |
| Samoans | 7.1 /100 | #214 | Tragic 97.7% |
| Bahamians | 6.8 /100 | #215 | Tragic 97.7% |
| South American Indians | 6.7 /100 | #216 | Tragic 97.7% |
| Uruguayans | 6.2 /100 | #217 | Tragic 97.7% |
| Sudanese | 5.7 /100 | #218 | Tragic 97.7% |
| Immigrants | Panama | 5.1 /100 | #219 | Tragic 97.6% |
| Immigrants | Morocco | 5.0 /100 | #220 | Tragic 97.6% |
| Iraqis | 4.6 /100 | #221 | Tragic 97.6% |
| Immigrants | Sudan | 4.5 /100 | #222 | Tragic 97.6% |
| Sierra Leoneans | 4.3 /100 | #223 | Tragic 97.6% |
| Immigrants | Zaire | 4.3 /100 | #224 | Tragic 97.6% |