Immigrants from Lithuania vs Uruguayan 2nd Grade
COMPARE
Immigrants from Lithuania
Uruguayan
2nd Grade
2nd Grade Comparison
Immigrants from Lithuania
Uruguayans
98.2%
2ND GRADE
99.3/ 100
METRIC RATING
78th/ 347
METRIC RANK
97.7%
2ND GRADE
6.2/ 100
METRIC RATING
217th/ 347
METRIC RANK
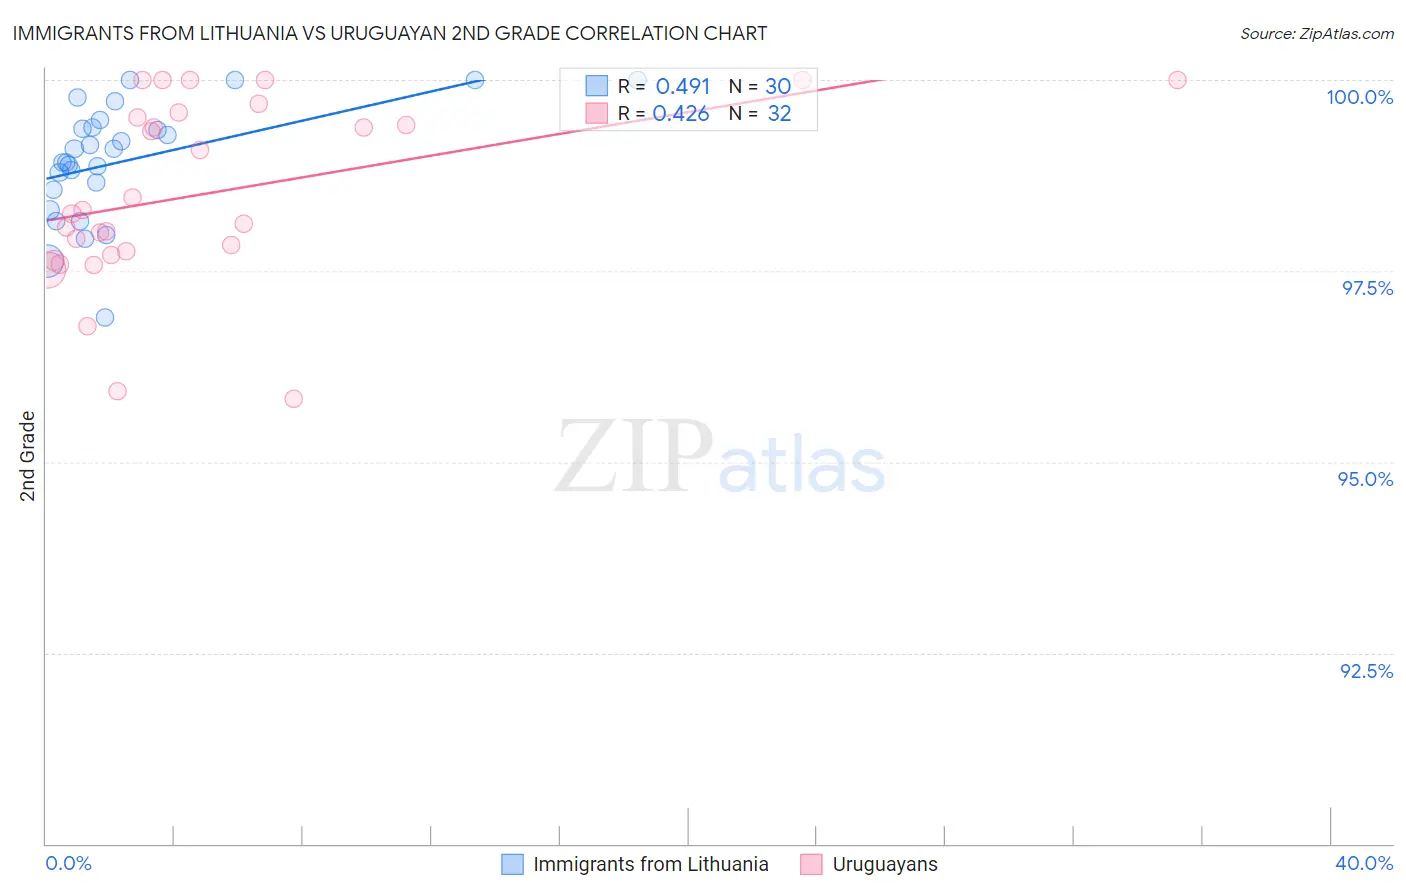
Immigrants from Lithuania vs Uruguayan 2nd Grade Correlation Chart
The statistical analysis conducted on geographies consisting of 117,724,932 people shows a moderate positive correlation between the proportion of Immigrants from Lithuania and percentage of population with at least 2nd grade education in the United States with a correlation coefficient (R) of 0.491 and weighted average of 98.2%. Similarly, the statistical analysis conducted on geographies consisting of 144,782,794 people shows a moderate positive correlation between the proportion of Uruguayans and percentage of population with at least 2nd grade education in the United States with a correlation coefficient (R) of 0.426 and weighted average of 97.7%, a difference of 0.60%.
2nd Grade Correlation Summary
| Measurement | Immigrants from Lithuania | Uruguayan |
| Minimum | 96.9% | 95.8% |
| Maximum | 100.0% | 100.0% |
| Range | 3.1% | 4.2% |
| Mean | 98.9% | 98.5% |
| Median | 99.0% | 98.3% |
| Interquartile 25% (IQ1) | 98.6% | 97.7% |
| Interquartile 75% (IQ3) | 99.4% | 99.5% |
| Interquartile Range (IQR) | 0.82% | 1.8% |
| Standard Deviation (Sample) | 0.76% | 1.2% |
| Standard Deviation (Population) | 0.75% | 1.2% |
Similar Demographics by 2nd Grade
Demographics Similar to Immigrants from Lithuania by 2nd Grade
In terms of 2nd grade, the demographic groups most similar to Immigrants from Lithuania are Immigrants from Belgium (98.2%, a difference of 0.0%), Osage (98.2%, a difference of 0.0%), Shoshone (98.3%, a difference of 0.010%), Cherokee (98.3%, a difference of 0.010%), and Immigrants from England (98.3%, a difference of 0.010%).
| Demographics | Rating | Rank | 2nd Grade |
| Chickasaw | 99.6 /100 | #71 | Exceptional 98.3% |
| Cheyenne | 99.6 /100 | #72 | Exceptional 98.3% |
| Cajuns | 99.5 /100 | #73 | Exceptional 98.3% |
| Immigrants | Netherlands | 99.4 /100 | #74 | Exceptional 98.3% |
| Shoshone | 99.4 /100 | #75 | Exceptional 98.3% |
| Cherokee | 99.4 /100 | #76 | Exceptional 98.3% |
| Immigrants | England | 99.4 /100 | #77 | Exceptional 98.3% |
| Immigrants | Lithuania | 99.3 /100 | #78 | Exceptional 98.2% |
| Immigrants | Belgium | 99.3 /100 | #79 | Exceptional 98.2% |
| Osage | 99.2 /100 | #80 | Exceptional 98.2% |
| Icelanders | 99.2 /100 | #81 | Exceptional 98.2% |
| Delaware | 99.1 /100 | #82 | Exceptional 98.2% |
| Immigrants | Sweden | 99.1 /100 | #83 | Exceptional 98.2% |
| Hopi | 99.1 /100 | #84 | Exceptional 98.2% |
| Potawatomi | 99.1 /100 | #85 | Exceptional 98.2% |
Demographics Similar to Uruguayans by 2nd Grade
In terms of 2nd grade, the demographic groups most similar to Uruguayans are Samoan (97.7%, a difference of 0.010%), Bahamian (97.7%, a difference of 0.010%), South American Indian (97.7%, a difference of 0.010%), Sudanese (97.7%, a difference of 0.010%), and Moroccan (97.7%, a difference of 0.020%).
| Demographics | Rating | Rank | 2nd Grade |
| Costa Ricans | 10.5 /100 | #210 | Poor 97.7% |
| Laotians | 9.9 /100 | #211 | Tragic 97.7% |
| Immigrants | Bahamas | 8.4 /100 | #212 | Tragic 97.7% |
| Moroccans | 8.2 /100 | #213 | Tragic 97.7% |
| Samoans | 7.1 /100 | #214 | Tragic 97.7% |
| Bahamians | 6.8 /100 | #215 | Tragic 97.7% |
| South American Indians | 6.7 /100 | #216 | Tragic 97.7% |
| Uruguayans | 6.2 /100 | #217 | Tragic 97.7% |
| Sudanese | 5.7 /100 | #218 | Tragic 97.7% |
| Immigrants | Panama | 5.1 /100 | #219 | Tragic 97.6% |
| Immigrants | Morocco | 5.0 /100 | #220 | Tragic 97.6% |
| Iraqis | 4.6 /100 | #221 | Tragic 97.6% |
| Immigrants | Sudan | 4.5 /100 | #222 | Tragic 97.6% |
| Sierra Leoneans | 4.3 /100 | #223 | Tragic 97.6% |
| Immigrants | Zaire | 4.3 /100 | #224 | Tragic 97.6% |