Pakistani vs Immigrants from Malaysia 2nd Grade
COMPARE
Pakistani
Immigrants from Malaysia
2nd Grade
2nd Grade Comparison
Pakistanis
Immigrants from Malaysia
97.8%
2ND GRADE
36.1/ 100
METRIC RATING
187th/ 347
METRIC RANK
97.6%
2ND GRADE
2.0/ 100
METRIC RATING
234th/ 347
METRIC RANK
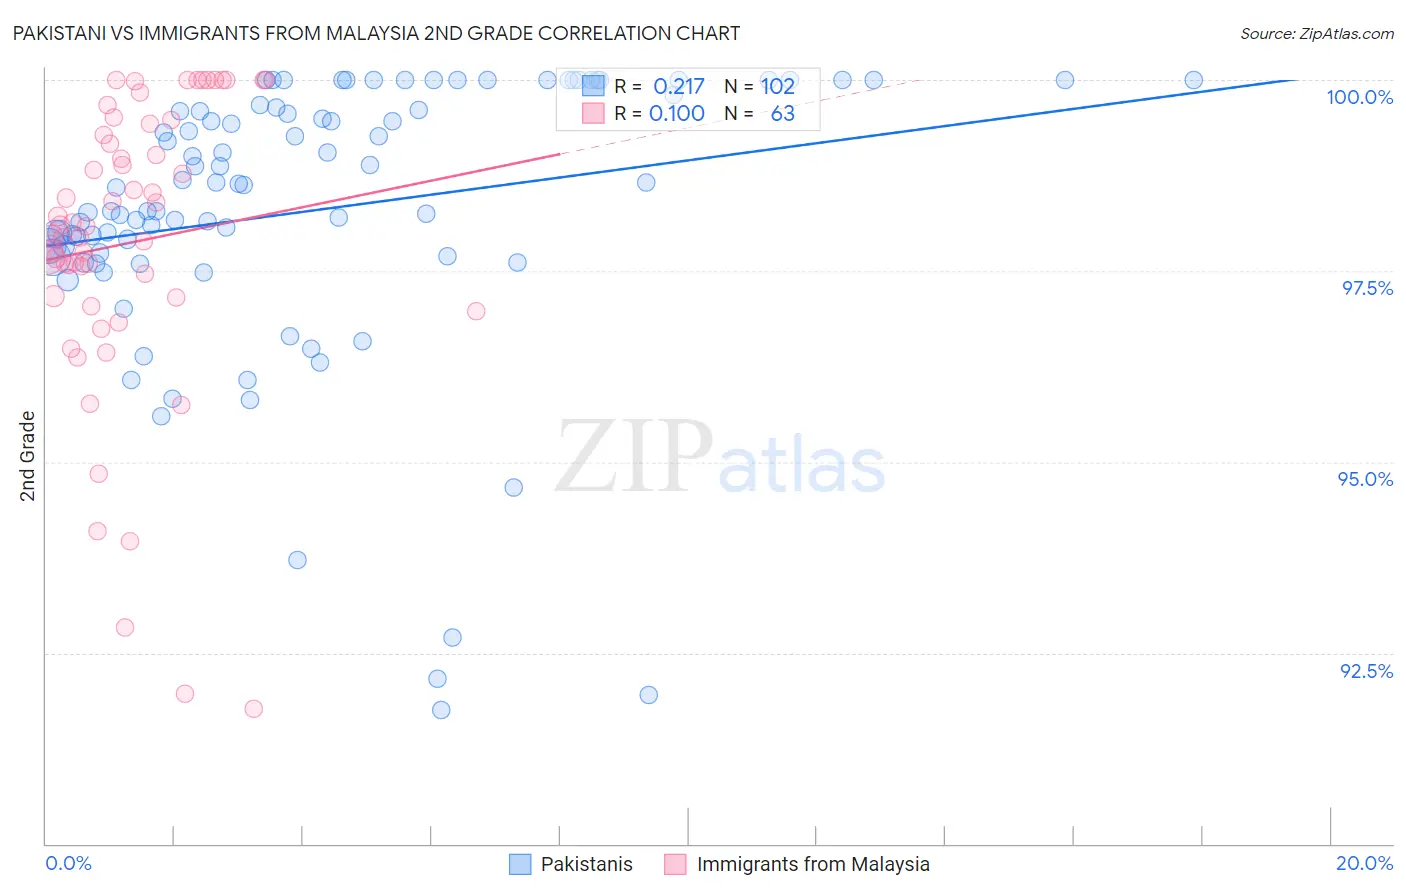
Pakistani vs Immigrants from Malaysia 2nd Grade Correlation Chart
The statistical analysis conducted on geographies consisting of 335,355,426 people shows a weak positive correlation between the proportion of Pakistanis and percentage of population with at least 2nd grade education in the United States with a correlation coefficient (R) of 0.217 and weighted average of 97.8%. Similarly, the statistical analysis conducted on geographies consisting of 197,973,709 people shows a poor positive correlation between the proportion of Immigrants from Malaysia and percentage of population with at least 2nd grade education in the United States with a correlation coefficient (R) of 0.100 and weighted average of 97.6%, a difference of 0.26%.
2nd Grade Correlation Summary
| Measurement | Pakistani | Immigrants from Malaysia |
| Minimum | 91.8% | 91.8% |
| Maximum | 100.0% | 100.0% |
| Range | 8.2% | 8.2% |
| Mean | 98.3% | 97.9% |
| Median | 98.6% | 98.1% |
| Interquartile 25% (IQ1) | 97.7% | 97.1% |
| Interquartile 75% (IQ3) | 99.7% | 99.4% |
| Interquartile Range (IQR) | 2.0% | 2.3% |
| Standard Deviation (Sample) | 1.8% | 1.9% |
| Standard Deviation (Population) | 1.8% | 1.9% |
Similar Demographics by 2nd Grade
Demographics Similar to Pakistanis by 2nd Grade
In terms of 2nd grade, the demographic groups most similar to Pakistanis are Arab (97.8%, a difference of 0.0%), Immigrants from Kazakhstan (97.8%, a difference of 0.0%), Panamanian (97.8%, a difference of 0.010%), Portuguese (97.8%, a difference of 0.020%), and Immigrants from Poland (97.8%, a difference of 0.020%).
| Demographics | Rating | Rank | 2nd Grade |
| Natives/Alaskans | 44.3 /100 | #180 | Average 97.9% |
| Egyptians | 44.3 /100 | #181 | Average 97.9% |
| Portuguese | 42.4 /100 | #182 | Average 97.8% |
| Immigrants | Poland | 42.2 /100 | #183 | Average 97.8% |
| Immigrants | Belarus | 41.5 /100 | #184 | Average 97.8% |
| Immigrants | Argentina | 40.6 /100 | #185 | Average 97.8% |
| Arabs | 36.9 /100 | #186 | Fair 97.8% |
| Pakistanis | 36.1 /100 | #187 | Fair 97.8% |
| Immigrants | Kazakhstan | 35.6 /100 | #188 | Fair 97.8% |
| Panamanians | 33.5 /100 | #189 | Fair 97.8% |
| Immigrants | Taiwan | 31.8 /100 | #190 | Fair 97.8% |
| Paraguayans | 30.8 /100 | #191 | Fair 97.8% |
| Blacks/African Americans | 29.9 /100 | #192 | Fair 97.8% |
| Hawaiians | 28.5 /100 | #193 | Fair 97.8% |
| Paiute | 27.0 /100 | #194 | Fair 97.8% |
Demographics Similar to Immigrants from Malaysia by 2nd Grade
In terms of 2nd grade, the demographic groups most similar to Immigrants from Malaysia are Immigrants from Western Asia (97.6%, a difference of 0.0%), Immigrants from Uruguay (97.6%, a difference of 0.0%), Colombian (97.6%, a difference of 0.0%), Immigrants from Pakistan (97.6%, a difference of 0.010%), and Nigerian (97.6%, a difference of 0.010%).
| Demographics | Rating | Rank | 2nd Grade |
| Immigrants | Nepal | 4.0 /100 | #227 | Tragic 97.6% |
| Sub-Saharan Africans | 3.4 /100 | #228 | Tragic 97.6% |
| Immigrants | Costa Rica | 3.1 /100 | #229 | Tragic 97.6% |
| Senegalese | 3.1 /100 | #230 | Tragic 97.6% |
| Immigrants | Pakistan | 2.3 /100 | #231 | Tragic 97.6% |
| Immigrants | Western Asia | 2.1 /100 | #232 | Tragic 97.6% |
| Immigrants | Uruguay | 2.1 /100 | #233 | Tragic 97.6% |
| Immigrants | Malaysia | 2.0 /100 | #234 | Tragic 97.6% |
| Colombians | 1.9 /100 | #235 | Tragic 97.6% |
| Nigerians | 1.7 /100 | #236 | Tragic 97.6% |
| U.S. Virgin Islanders | 1.6 /100 | #237 | Tragic 97.6% |
| Immigrants | Eastern Asia | 1.6 /100 | #238 | Tragic 97.6% |
| Liberians | 1.6 /100 | #239 | Tragic 97.6% |
| Koreans | 1.5 /100 | #240 | Tragic 97.5% |
| Ethiopians | 1.2 /100 | #241 | Tragic 97.5% |