Pakistani vs Immigrants from Belize 8th Grade
COMPARE
Pakistani
Immigrants from Belize
8th Grade
8th Grade Comparison
Pakistanis
Immigrants from Belize
95.7%
8TH GRADE
48.8/ 100
METRIC RATING
176th/ 347
METRIC RANK
92.9%
8TH GRADE
0.0/ 100
METRIC RATING
323rd/ 347
METRIC RANK
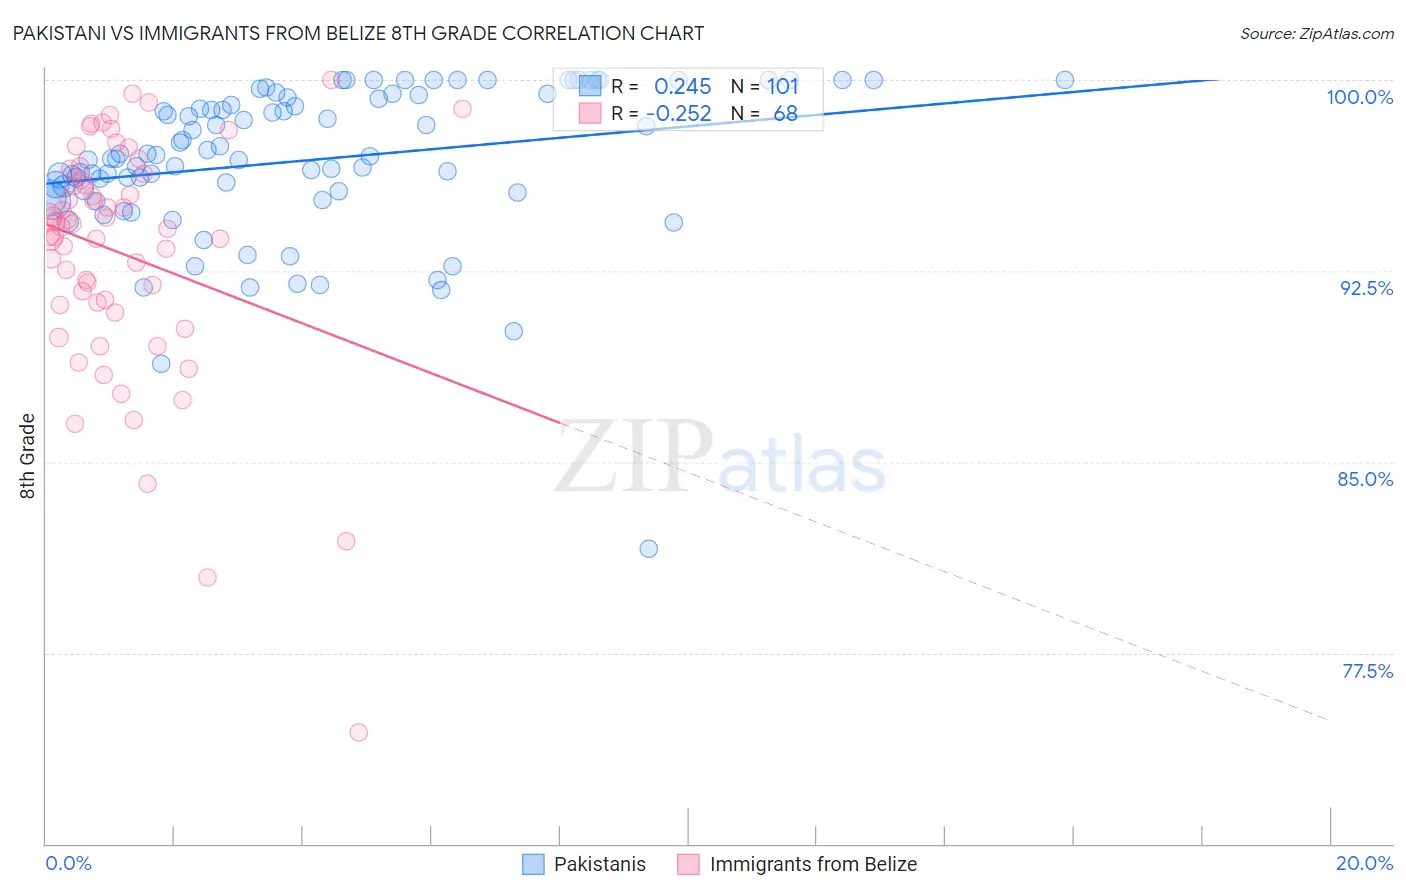
Pakistani vs Immigrants from Belize 8th Grade Correlation Chart
The statistical analysis conducted on geographies consisting of 335,355,370 people shows a weak positive correlation between the proportion of Pakistanis and percentage of population with at least 8th grade education in the United States with a correlation coefficient (R) of 0.245 and weighted average of 95.7%. Similarly, the statistical analysis conducted on geographies consisting of 130,181,087 people shows a weak negative correlation between the proportion of Immigrants from Belize and percentage of population with at least 8th grade education in the United States with a correlation coefficient (R) of -0.252 and weighted average of 92.9%, a difference of 3.0%.
8th Grade Correlation Summary
| Measurement | Pakistani | Immigrants from Belize |
| Minimum | 81.6% | 74.3% |
| Maximum | 100.0% | 100.0% |
| Range | 18.4% | 25.7% |
| Mean | 96.8% | 93.2% |
| Median | 97.0% | 94.2% |
| Interquartile 25% (IQ1) | 95.6% | 91.2% |
| Interquartile 75% (IQ3) | 99.4% | 96.2% |
| Interquartile Range (IQR) | 3.8% | 5.0% |
| Standard Deviation (Sample) | 3.0% | 4.7% |
| Standard Deviation (Population) | 3.0% | 4.7% |
Similar Demographics by 8th Grade
Demographics Similar to Pakistanis by 8th Grade
In terms of 8th grade, the demographic groups most similar to Pakistanis are Chilean (95.7%, a difference of 0.010%), Immigrants from Albania (95.7%, a difference of 0.010%), Marshallese (95.7%, a difference of 0.010%), Venezuelan (95.7%, a difference of 0.010%), and Immigrants from Brazil (95.7%, a difference of 0.020%).
| Demographics | Rating | Rank | 8th Grade |
| Immigrants | Iran | 58.6 /100 | #169 | Average 95.8% |
| Ute | 58.5 /100 | #170 | Average 95.8% |
| Egyptians | 58.2 /100 | #171 | Average 95.8% |
| Immigrants | Korea | 57.9 /100 | #172 | Average 95.8% |
| Mongolians | 53.0 /100 | #173 | Average 95.8% |
| Chileans | 50.0 /100 | #174 | Average 95.7% |
| Immigrants | Albania | 49.6 /100 | #175 | Average 95.7% |
| Pakistanis | 48.8 /100 | #176 | Average 95.7% |
| Marshallese | 47.6 /100 | #177 | Average 95.7% |
| Venezuelans | 47.5 /100 | #178 | Average 95.7% |
| Immigrants | Brazil | 45.4 /100 | #179 | Average 95.7% |
| Iraqis | 40.5 /100 | #180 | Average 95.7% |
| Immigrants | Spain | 38.7 /100 | #181 | Fair 95.7% |
| Immigrants | Egypt | 37.9 /100 | #182 | Fair 95.7% |
| Immigrants | Iraq | 36.2 /100 | #183 | Fair 95.6% |
Demographics Similar to Immigrants from Belize by 8th Grade
In terms of 8th grade, the demographic groups most similar to Immigrants from Belize are Nicaraguan (93.0%, a difference of 0.050%), Nepalese (92.8%, a difference of 0.070%), Dominican (92.8%, a difference of 0.16%), Belizean (93.1%, a difference of 0.17%), and Central American Indian (92.7%, a difference of 0.21%).
| Demographics | Rating | Rank | 8th Grade |
| Immigrants | Cambodia | 0.0 /100 | #316 | Tragic 93.3% |
| Immigrants | Ecuador | 0.0 /100 | #317 | Tragic 93.3% |
| Puerto Ricans | 0.0 /100 | #318 | Tragic 93.2% |
| Immigrants | Cuba | 0.0 /100 | #319 | Tragic 93.2% |
| Immigrants | Fiji | 0.0 /100 | #320 | Tragic 93.2% |
| Belizeans | 0.0 /100 | #321 | Tragic 93.1% |
| Nicaraguans | 0.0 /100 | #322 | Tragic 93.0% |
| Immigrants | Belize | 0.0 /100 | #323 | Tragic 92.9% |
| Nepalese | 0.0 /100 | #324 | Tragic 92.8% |
| Dominicans | 0.0 /100 | #325 | Tragic 92.8% |
| Central American Indians | 0.0 /100 | #326 | Tragic 92.7% |
| Immigrants | Azores | 0.0 /100 | #327 | Tragic 92.5% |
| Immigrants | Nicaragua | 0.0 /100 | #328 | Tragic 92.5% |
| Immigrants | Cabo Verde | 0.0 /100 | #329 | Tragic 92.4% |
| Immigrants | Armenia | 0.0 /100 | #330 | Tragic 92.3% |