Croatian vs Immigrants from Trinidad and Tobago 3rd Grade
COMPARE
Croatian
Immigrants from Trinidad and Tobago
3rd Grade
3rd Grade Comparison
Croatians
Immigrants from Trinidad and Tobago
98.5%
3RD GRADE
100.0/ 100
METRIC RATING
27th/ 347
METRIC RANK
97.1%
3RD GRADE
0.0/ 100
METRIC RATING
284th/ 347
METRIC RANK
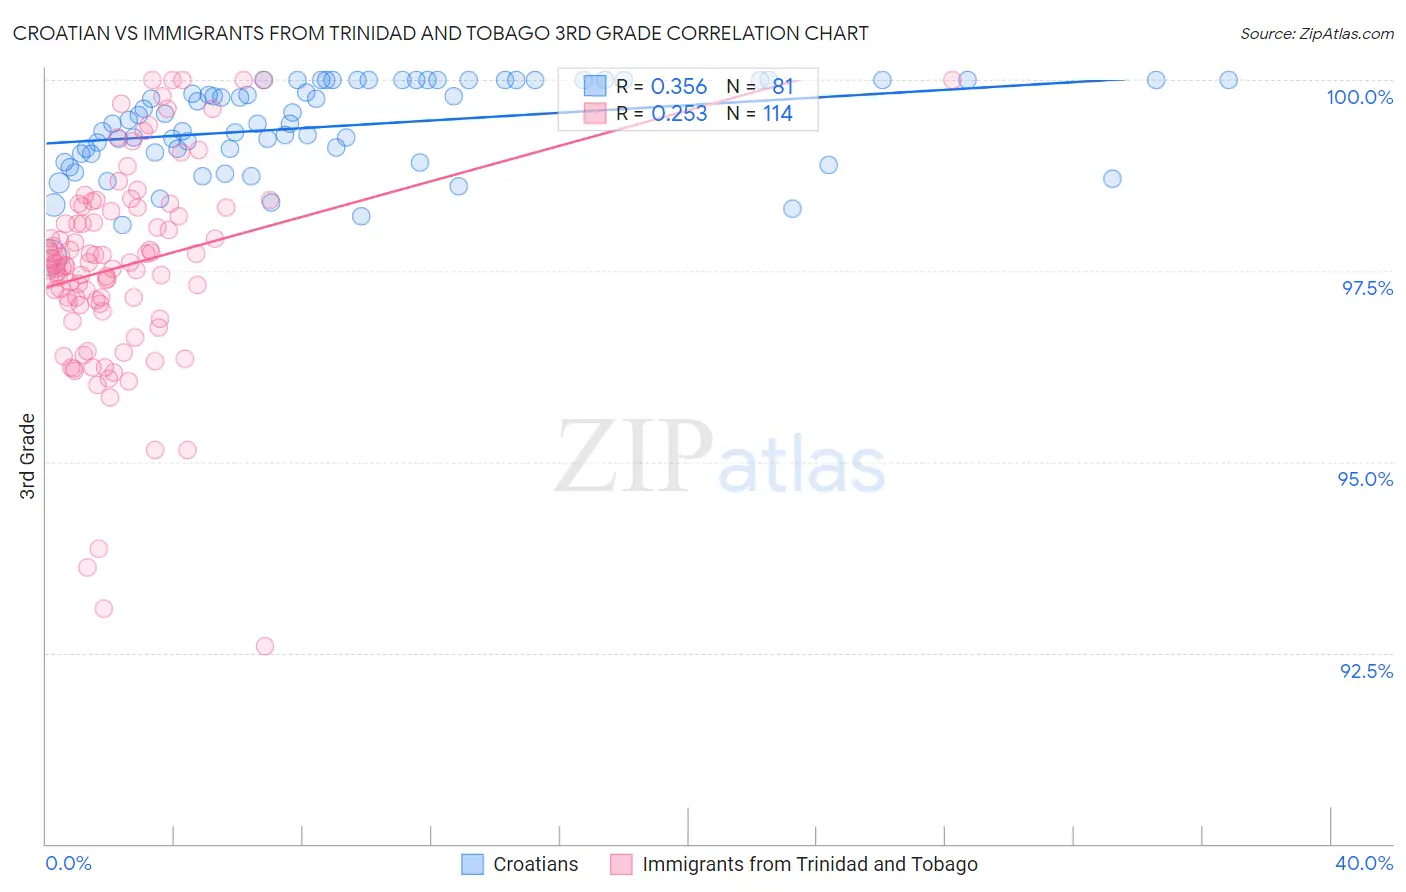
Croatian vs Immigrants from Trinidad and Tobago 3rd Grade Correlation Chart
The statistical analysis conducted on geographies consisting of 375,731,938 people shows a mild positive correlation between the proportion of Croatians and percentage of population with at least 3rd grade education in the United States with a correlation coefficient (R) of 0.356 and weighted average of 98.5%. Similarly, the statistical analysis conducted on geographies consisting of 223,526,834 people shows a weak positive correlation between the proportion of Immigrants from Trinidad and Tobago and percentage of population with at least 3rd grade education in the United States with a correlation coefficient (R) of 0.253 and weighted average of 97.1%, a difference of 1.4%.
3rd Grade Correlation Summary
| Measurement | Croatian | Immigrants from Trinidad and Tobago |
| Minimum | 97.7% | 92.6% |
| Maximum | 100.0% | 100.0% |
| Range | 2.3% | 7.4% |
| Mean | 99.4% | 97.6% |
| Median | 99.4% | 97.6% |
| Interquartile 25% (IQ1) | 99.0% | 97.1% |
| Interquartile 75% (IQ3) | 100.0% | 98.3% |
| Interquartile Range (IQR) | 0.96% | 1.3% |
| Standard Deviation (Sample) | 0.58% | 1.3% |
| Standard Deviation (Population) | 0.57% | 1.3% |
Similar Demographics by 3rd Grade
Demographics Similar to Croatians by 3rd Grade
In terms of 3rd grade, the demographic groups most similar to Croatians are Scotch-Irish (98.5%, a difference of 0.010%), Aleut (98.5%, a difference of 0.010%), French (98.4%, a difference of 0.010%), Finnish (98.5%, a difference of 0.020%), and Sioux (98.5%, a difference of 0.020%).
| Demographics | Rating | Rank | 3rd Grade |
| Pennsylvania Germans | 100.0 /100 | #20 | Exceptional 98.5% |
| Lithuanians | 100.0 /100 | #21 | Exceptional 98.5% |
| Finns | 100.0 /100 | #22 | Exceptional 98.5% |
| Sioux | 100.0 /100 | #23 | Exceptional 98.5% |
| Danes | 100.0 /100 | #24 | Exceptional 98.5% |
| Scotch-Irish | 100.0 /100 | #25 | Exceptional 98.5% |
| Aleuts | 100.0 /100 | #26 | Exceptional 98.5% |
| Croatians | 100.0 /100 | #27 | Exceptional 98.5% |
| French | 100.0 /100 | #28 | Exceptional 98.4% |
| French Canadians | 100.0 /100 | #29 | Exceptional 98.4% |
| Europeans | 100.0 /100 | #30 | Exceptional 98.4% |
| Czechs | 100.0 /100 | #31 | Exceptional 98.4% |
| Scandinavians | 100.0 /100 | #32 | Exceptional 98.4% |
| Chinese | 100.0 /100 | #33 | Exceptional 98.4% |
| Swiss | 100.0 /100 | #34 | Exceptional 98.4% |
Demographics Similar to Immigrants from Trinidad and Tobago by 3rd Grade
In terms of 3rd grade, the demographic groups most similar to Immigrants from Trinidad and Tobago are Afghan (97.1%, a difference of 0.020%), Houma (97.1%, a difference of 0.020%), Immigrants from Hong Kong (97.1%, a difference of 0.020%), Barbadian (97.2%, a difference of 0.030%), and Immigrants from Barbados (97.1%, a difference of 0.030%).
| Demographics | Rating | Rank | 3rd Grade |
| Trinidadians and Tobagonians | 0.1 /100 | #277 | Tragic 97.2% |
| Immigrants | Western Africa | 0.1 /100 | #278 | Tragic 97.2% |
| Immigrants | Philippines | 0.1 /100 | #279 | Tragic 97.2% |
| Immigrants | Ghana | 0.1 /100 | #280 | Tragic 97.2% |
| Barbadians | 0.1 /100 | #281 | Tragic 97.2% |
| Afghans | 0.1 /100 | #282 | Tragic 97.1% |
| Houma | 0.1 /100 | #283 | Tragic 97.1% |
| Immigrants | Trinidad and Tobago | 0.0 /100 | #284 | Tragic 97.1% |
| Immigrants | Hong Kong | 0.0 /100 | #285 | Tragic 97.1% |
| Immigrants | Barbados | 0.0 /100 | #286 | Tragic 97.1% |
| Immigrants | St. Vincent and the Grenadines | 0.0 /100 | #287 | Tragic 97.1% |
| Immigrants | West Indies | 0.0 /100 | #288 | Tragic 97.1% |
| Immigrants | Thailand | 0.0 /100 | #289 | Tragic 97.1% |
| Immigrants | Portugal | 0.0 /100 | #290 | Tragic 97.0% |
| Immigrants | Afghanistan | 0.0 /100 | #291 | Tragic 97.0% |