Ottawa vs Immigrants from Western Africa 9th Grade
COMPARE
Ottawa
Immigrants from Western Africa
9th Grade
9th Grade Comparison
Ottawa
Immigrants from Western Africa
96.1%
9TH GRADE
99.9/ 100
METRIC RATING
39th/ 347
METRIC RANK
93.8%
9TH GRADE
0.2/ 100
METRIC RATING
272nd/ 347
METRIC RANK
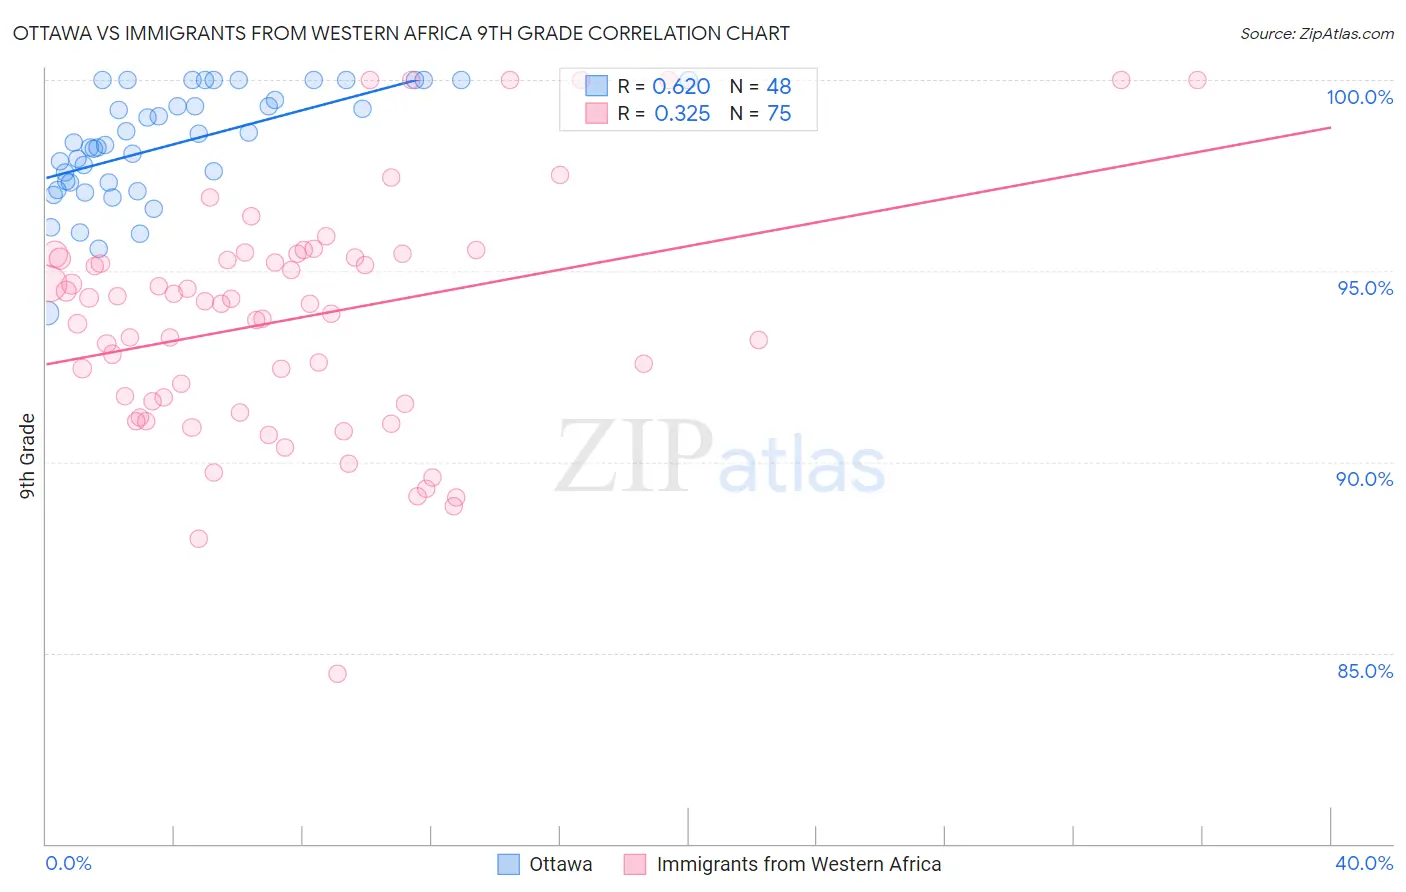
Ottawa vs Immigrants from Western Africa 9th Grade Correlation Chart
The statistical analysis conducted on geographies consisting of 49,956,726 people shows a significant positive correlation between the proportion of Ottawa and percentage of population with at least 9th grade education in the United States with a correlation coefficient (R) of 0.620 and weighted average of 96.1%. Similarly, the statistical analysis conducted on geographies consisting of 357,883,667 people shows a mild positive correlation between the proportion of Immigrants from Western Africa and percentage of population with at least 9th grade education in the United States with a correlation coefficient (R) of 0.325 and weighted average of 93.8%, a difference of 2.5%.
9th Grade Correlation Summary
| Measurement | Ottawa | Immigrants from Western Africa |
| Minimum | 93.9% | 84.5% |
| Maximum | 100.0% | 100.0% |
| Range | 6.1% | 15.5% |
| Mean | 98.3% | 93.8% |
| Median | 98.3% | 94.1% |
| Interquartile 25% (IQ1) | 97.3% | 91.5% |
| Interquartile 75% (IQ3) | 99.7% | 95.4% |
| Interquartile Range (IQR) | 2.4% | 3.9% |
| Standard Deviation (Sample) | 1.5% | 3.1% |
| Standard Deviation (Population) | 1.4% | 3.1% |
Similar Demographics by 9th Grade
Demographics Similar to Ottawa by 9th Grade
In terms of 9th grade, the demographic groups most similar to Ottawa are Estonian (96.1%, a difference of 0.020%), Immigrants from Scotland (96.1%, a difference of 0.020%), Slavic (96.1%, a difference of 0.020%), Czechoslovakian (96.1%, a difference of 0.030%), and Chippewa (96.1%, a difference of 0.030%).
| Demographics | Rating | Rank | 9th Grade |
| Belgians | 100.0 /100 | #32 | Exceptional 96.3% |
| Luxembourgers | 100.0 /100 | #33 | Exceptional 96.3% |
| Hungarians | 100.0 /100 | #34 | Exceptional 96.2% |
| Bulgarians | 99.9 /100 | #35 | Exceptional 96.2% |
| Northern Europeans | 99.9 /100 | #36 | Exceptional 96.2% |
| Estonians | 99.9 /100 | #37 | Exceptional 96.1% |
| Immigrants | Scotland | 99.9 /100 | #38 | Exceptional 96.1% |
| Ottawa | 99.9 /100 | #39 | Exceptional 96.1% |
| Slavs | 99.9 /100 | #40 | Exceptional 96.1% |
| Czechoslovakians | 99.9 /100 | #41 | Exceptional 96.1% |
| Chippewa | 99.9 /100 | #42 | Exceptional 96.1% |
| Iranians | 99.9 /100 | #43 | Exceptional 96.1% |
| Alaska Natives | 99.9 /100 | #44 | Exceptional 96.1% |
| Crow | 99.9 /100 | #45 | Exceptional 96.1% |
| Immigrants | India | 99.9 /100 | #46 | Exceptional 96.1% |
Demographics Similar to Immigrants from Western Africa by 9th Grade
In terms of 9th grade, the demographic groups most similar to Immigrants from Western Africa are Immigrants from Ghana (93.8%, a difference of 0.010%), Immigrants from South America (93.8%, a difference of 0.010%), Peruvian (93.8%, a difference of 0.010%), Immigrants from Colombia (93.8%, a difference of 0.020%), and Yuman (93.8%, a difference of 0.030%).
| Demographics | Rating | Rank | 9th Grade |
| Natives/Alaskans | 0.4 /100 | #265 | Tragic 93.9% |
| Navajo | 0.3 /100 | #266 | Tragic 93.9% |
| Armenians | 0.3 /100 | #267 | Tragic 93.9% |
| Immigrants | Bolivia | 0.3 /100 | #268 | Tragic 93.9% |
| Immigrants | Uruguay | 0.2 /100 | #269 | Tragic 93.8% |
| Yuman | 0.2 /100 | #270 | Tragic 93.8% |
| Immigrants | Ghana | 0.2 /100 | #271 | Tragic 93.8% |
| Immigrants | Western Africa | 0.2 /100 | #272 | Tragic 93.8% |
| Immigrants | South America | 0.2 /100 | #273 | Tragic 93.8% |
| Peruvians | 0.2 /100 | #274 | Tragic 93.8% |
| Immigrants | Colombia | 0.2 /100 | #275 | Tragic 93.8% |
| West Indians | 0.2 /100 | #276 | Tragic 93.7% |
| Immigrants | Philippines | 0.1 /100 | #277 | Tragic 93.7% |
| Immigrants | Eritrea | 0.1 /100 | #278 | Tragic 93.7% |
| Trinidadians and Tobagonians | 0.1 /100 | #279 | Tragic 93.7% |