European vs Immigrants from Western Africa 9th Grade
COMPARE
European
Immigrants from Western Africa
9th Grade
9th Grade Comparison
Europeans
Immigrants from Western Africa
96.4%
9TH GRADE
100.0/ 100
METRIC RATING
22nd/ 347
METRIC RANK
93.8%
9TH GRADE
0.2/ 100
METRIC RATING
272nd/ 347
METRIC RANK
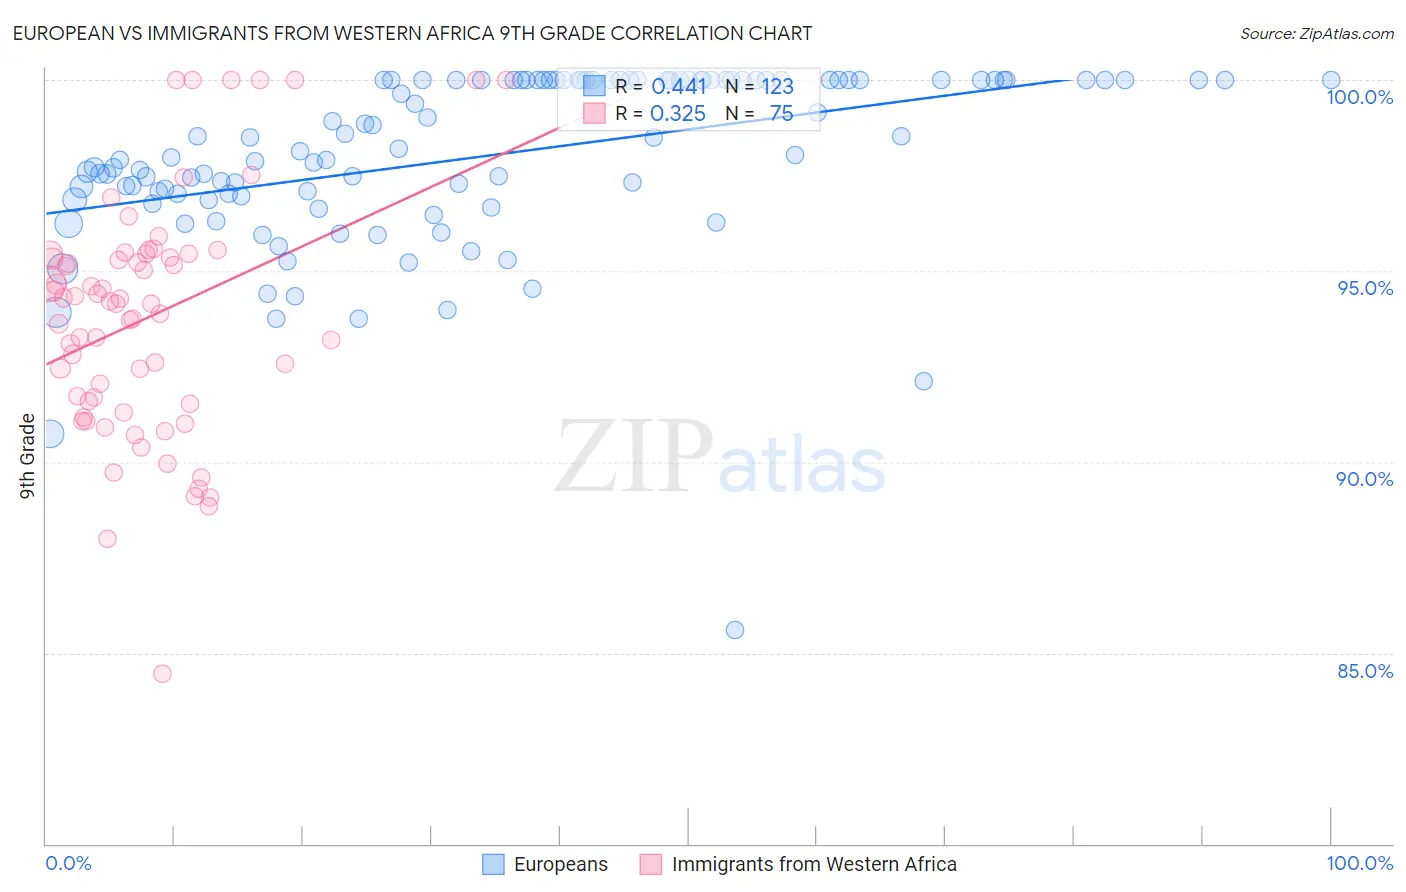
European vs Immigrants from Western Africa 9th Grade Correlation Chart
The statistical analysis conducted on geographies consisting of 561,829,476 people shows a moderate positive correlation between the proportion of Europeans and percentage of population with at least 9th grade education in the United States with a correlation coefficient (R) of 0.441 and weighted average of 96.4%. Similarly, the statistical analysis conducted on geographies consisting of 357,883,667 people shows a mild positive correlation between the proportion of Immigrants from Western Africa and percentage of population with at least 9th grade education in the United States with a correlation coefficient (R) of 0.325 and weighted average of 93.8%, a difference of 2.8%.
9th Grade Correlation Summary
| Measurement | European | Immigrants from Western Africa |
| Minimum | 85.6% | 84.5% |
| Maximum | 100.0% | 100.0% |
| Range | 14.4% | 15.5% |
| Mean | 98.0% | 93.8% |
| Median | 98.2% | 94.1% |
| Interquartile 25% (IQ1) | 96.9% | 91.5% |
| Interquartile 75% (IQ3) | 100.0% | 95.4% |
| Interquartile Range (IQR) | 3.1% | 3.9% |
| Standard Deviation (Sample) | 2.3% | 3.1% |
| Standard Deviation (Population) | 2.3% | 3.1% |
Similar Demographics by 9th Grade
Demographics Similar to Europeans by 9th Grade
In terms of 9th grade, the demographic groups most similar to Europeans are Alaskan Athabascan (96.4%, a difference of 0.010%), Czech (96.4%, a difference of 0.010%), Italian (96.4%, a difference of 0.020%), Welsh (96.4%, a difference of 0.030%), and Latvian (96.4%, a difference of 0.040%).
| Demographics | Rating | Rank | 9th Grade |
| Irish | 100.0 /100 | #15 | Exceptional 96.5% |
| Croatians | 100.0 /100 | #16 | Exceptional 96.5% |
| Dutch | 100.0 /100 | #17 | Exceptional 96.5% |
| Scandinavians | 100.0 /100 | #18 | Exceptional 96.5% |
| Welsh | 100.0 /100 | #19 | Exceptional 96.4% |
| Italians | 100.0 /100 | #20 | Exceptional 96.4% |
| Alaskan Athabascans | 100.0 /100 | #21 | Exceptional 96.4% |
| Europeans | 100.0 /100 | #22 | Exceptional 96.4% |
| Czechs | 100.0 /100 | #23 | Exceptional 96.4% |
| Latvians | 100.0 /100 | #24 | Exceptional 96.4% |
| French | 100.0 /100 | #25 | Exceptional 96.3% |
| French Canadians | 100.0 /100 | #26 | Exceptional 96.3% |
| Scotch-Irish | 100.0 /100 | #27 | Exceptional 96.3% |
| Eastern Europeans | 100.0 /100 | #28 | Exceptional 96.3% |
| Chinese | 100.0 /100 | #29 | Exceptional 96.3% |
Demographics Similar to Immigrants from Western Africa by 9th Grade
In terms of 9th grade, the demographic groups most similar to Immigrants from Western Africa are Immigrants from Ghana (93.8%, a difference of 0.010%), Immigrants from South America (93.8%, a difference of 0.010%), Peruvian (93.8%, a difference of 0.010%), Immigrants from Colombia (93.8%, a difference of 0.020%), and Yuman (93.8%, a difference of 0.030%).
| Demographics | Rating | Rank | 9th Grade |
| Natives/Alaskans | 0.4 /100 | #265 | Tragic 93.9% |
| Navajo | 0.3 /100 | #266 | Tragic 93.9% |
| Armenians | 0.3 /100 | #267 | Tragic 93.9% |
| Immigrants | Bolivia | 0.3 /100 | #268 | Tragic 93.9% |
| Immigrants | Uruguay | 0.2 /100 | #269 | Tragic 93.8% |
| Yuman | 0.2 /100 | #270 | Tragic 93.8% |
| Immigrants | Ghana | 0.2 /100 | #271 | Tragic 93.8% |
| Immigrants | Western Africa | 0.2 /100 | #272 | Tragic 93.8% |
| Immigrants | South America | 0.2 /100 | #273 | Tragic 93.8% |
| Peruvians | 0.2 /100 | #274 | Tragic 93.8% |
| Immigrants | Colombia | 0.2 /100 | #275 | Tragic 93.8% |
| West Indians | 0.2 /100 | #276 | Tragic 93.7% |
| Immigrants | Philippines | 0.1 /100 | #277 | Tragic 93.7% |
| Immigrants | Eritrea | 0.1 /100 | #278 | Tragic 93.7% |
| Trinidadians and Tobagonians | 0.1 /100 | #279 | Tragic 93.7% |