Ghanaian vs Immigrants from Belize 10th Grade
COMPARE
Ghanaian
Immigrants from Belize
10th Grade
10th Grade Comparison
Ghanaians
Immigrants from Belize
92.8%
10TH GRADE
0.9/ 100
METRIC RATING
253rd/ 347
METRIC RANK
90.1%
10TH GRADE
0.0/ 100
METRIC RATING
323rd/ 347
METRIC RANK
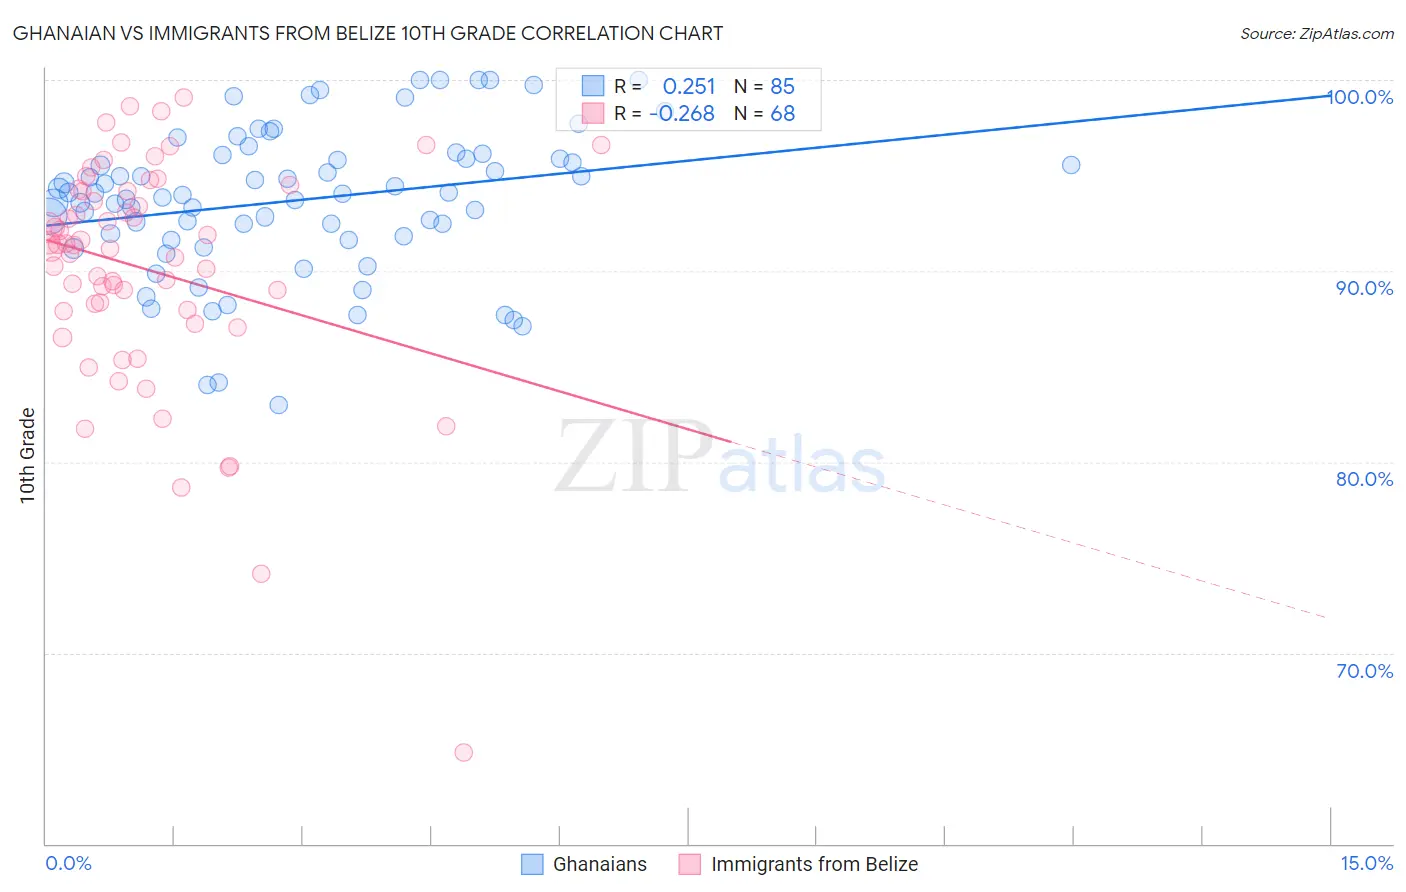
Ghanaian vs Immigrants from Belize 10th Grade Correlation Chart
The statistical analysis conducted on geographies consisting of 190,714,671 people shows a weak positive correlation between the proportion of Ghanaians and percentage of population with at least 10th grade education in the United States with a correlation coefficient (R) of 0.251 and weighted average of 92.8%. Similarly, the statistical analysis conducted on geographies consisting of 130,181,087 people shows a weak negative correlation between the proportion of Immigrants from Belize and percentage of population with at least 10th grade education in the United States with a correlation coefficient (R) of -0.268 and weighted average of 90.1%, a difference of 3.0%.
10th Grade Correlation Summary
| Measurement | Ghanaian | Immigrants from Belize |
| Minimum | 83.0% | 64.8% |
| Maximum | 100.0% | 99.1% |
| Range | 17.0% | 34.4% |
| Mean | 93.7% | 90.1% |
| Median | 94.1% | 91.3% |
| Interquartile 25% (IQ1) | 91.7% | 87.9% |
| Interquartile 75% (IQ3) | 96.0% | 94.2% |
| Interquartile Range (IQR) | 4.3% | 6.2% |
| Standard Deviation (Sample) | 3.8% | 6.0% |
| Standard Deviation (Population) | 3.8% | 6.0% |
Similar Demographics by 10th Grade
Demographics Similar to Ghanaians by 10th Grade
In terms of 10th grade, the demographic groups most similar to Ghanaians are South American (92.8%, a difference of 0.0%), Immigrants from Thailand (92.8%, a difference of 0.010%), Armenian (92.7%, a difference of 0.010%), Jamaican (92.8%, a difference of 0.060%), and Immigrants from Bolivia (92.7%, a difference of 0.060%).
| Demographics | Rating | Rank | 10th Grade |
| Immigrants | Middle Africa | 1.7 /100 | #246 | Tragic 92.9% |
| Immigrants | Afghanistan | 1.4 /100 | #247 | Tragic 92.8% |
| Colombians | 1.4 /100 | #248 | Tragic 92.8% |
| Immigrants | Senegal | 1.4 /100 | #249 | Tragic 92.8% |
| Jamaicans | 1.2 /100 | #250 | Tragic 92.8% |
| Immigrants | Thailand | 1.0 /100 | #251 | Tragic 92.8% |
| South Americans | 0.9 /100 | #252 | Tragic 92.8% |
| Ghanaians | 0.9 /100 | #253 | Tragic 92.8% |
| Armenians | 0.9 /100 | #254 | Tragic 92.7% |
| Immigrants | Bolivia | 0.7 /100 | #255 | Tragic 92.7% |
| Immigrants | Nigeria | 0.7 /100 | #256 | Tragic 92.7% |
| U.S. Virgin Islanders | 0.7 /100 | #257 | Tragic 92.7% |
| Immigrants | Costa Rica | 0.6 /100 | #258 | Tragic 92.7% |
| Immigrants | Jamaica | 0.5 /100 | #259 | Tragic 92.6% |
| Immigrants | Uzbekistan | 0.5 /100 | #260 | Tragic 92.6% |
Demographics Similar to Immigrants from Belize by 10th Grade
In terms of 10th grade, the demographic groups most similar to Immigrants from Belize are Tohono O'odham (90.1%, a difference of 0.090%), Belizean (90.2%, a difference of 0.10%), Nicaraguan (90.2%, a difference of 0.11%), Houma (90.2%, a difference of 0.11%), and Immigrants from Cuba (90.2%, a difference of 0.19%).
| Demographics | Rating | Rank | 10th Grade |
| Ecuadorians | 0.0 /100 | #316 | Tragic 90.6% |
| Immigrants | Ecuador | 0.0 /100 | #317 | Tragic 90.4% |
| Immigrants | Cuba | 0.0 /100 | #318 | Tragic 90.2% |
| Nicaraguans | 0.0 /100 | #319 | Tragic 90.2% |
| Houma | 0.0 /100 | #320 | Tragic 90.2% |
| Belizeans | 0.0 /100 | #321 | Tragic 90.2% |
| Tohono O'odham | 0.0 /100 | #322 | Tragic 90.1% |
| Immigrants | Belize | 0.0 /100 | #323 | Tragic 90.1% |
| Immigrants | Armenia | 0.0 /100 | #324 | Tragic 89.9% |
| Puerto Ricans | 0.0 /100 | #325 | Tragic 89.8% |
| Central American Indians | 0.0 /100 | #326 | Tragic 89.7% |
| Immigrants | Nicaragua | 0.0 /100 | #327 | Tragic 89.5% |
| Immigrants | Cabo Verde | 0.0 /100 | #328 | Tragic 89.5% |
| Dominicans | 0.0 /100 | #329 | Tragic 89.4% |
| Immigrants | Yemen | 0.0 /100 | #330 | Tragic 89.1% |