Osage vs Immigrants from Turkey 10th Grade
COMPARE
Osage
Immigrants from Turkey
10th Grade
10th Grade Comparison
Osage
Immigrants from Turkey
94.2%
10TH GRADE
91.7/ 100
METRIC RATING
134th/ 347
METRIC RANK
94.5%
10TH GRADE
97.4/ 100
METRIC RATING
105th/ 347
METRIC RANK
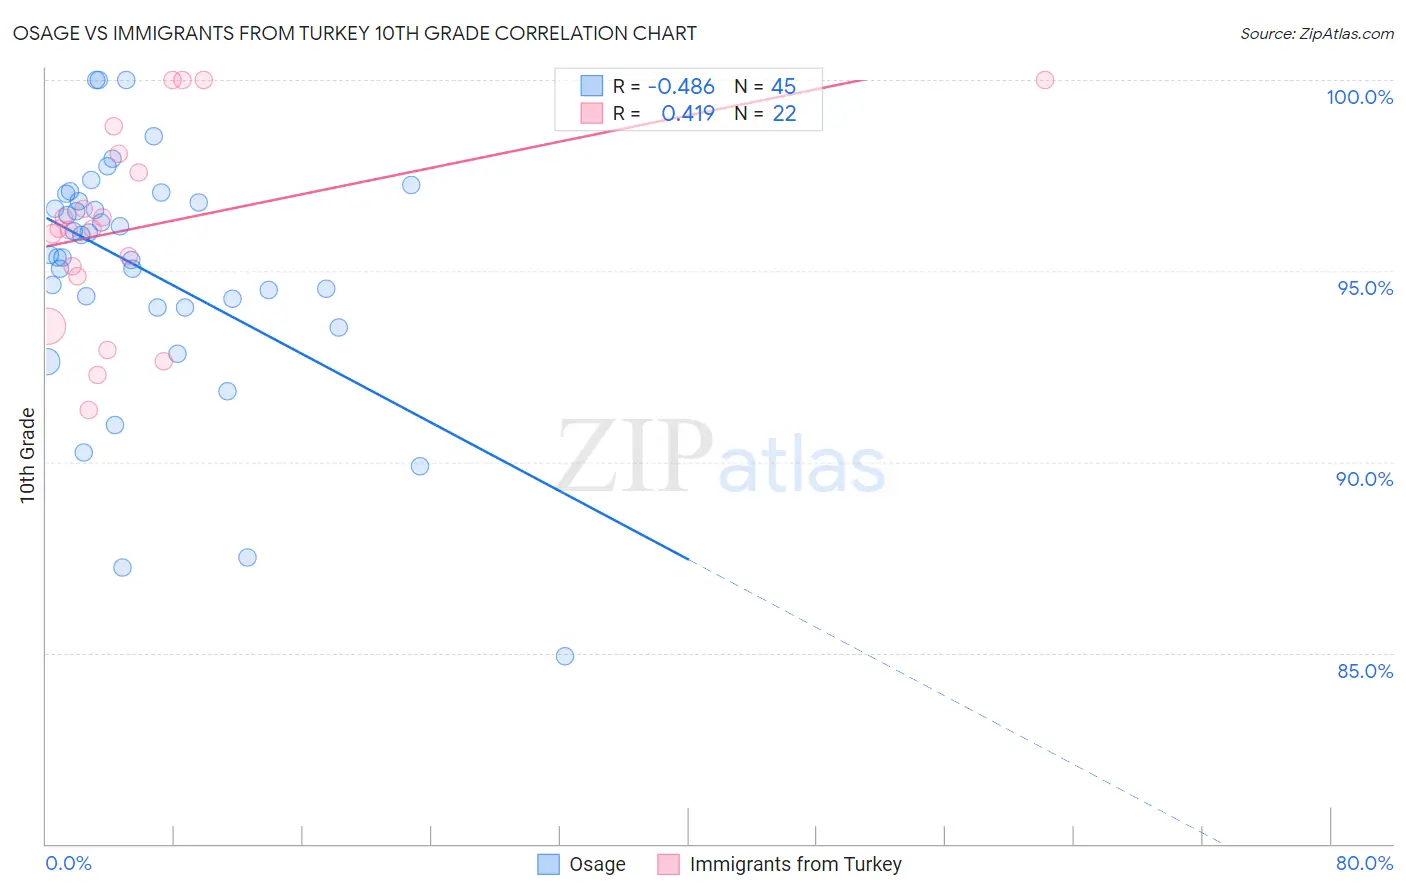
Osage vs Immigrants from Turkey 10th Grade Correlation Chart
The statistical analysis conducted on geographies consisting of 91,808,929 people shows a moderate negative correlation between the proportion of Osage and percentage of population with at least 10th grade education in the United States with a correlation coefficient (R) of -0.486 and weighted average of 94.2%. Similarly, the statistical analysis conducted on geographies consisting of 223,057,877 people shows a moderate positive correlation between the proportion of Immigrants from Turkey and percentage of population with at least 10th grade education in the United States with a correlation coefficient (R) of 0.419 and weighted average of 94.5%, a difference of 0.27%.
10th Grade Correlation Summary
| Measurement | Osage | Immigrants from Turkey |
| Minimum | 84.9% | 91.4% |
| Maximum | 100.0% | 100.0% |
| Range | 15.1% | 8.6% |
| Mean | 95.0% | 96.2% |
| Median | 95.4% | 96.1% |
| Interquartile 25% (IQ1) | 94.0% | 94.9% |
| Interquartile 75% (IQ3) | 96.9% | 98.1% |
| Interquartile Range (IQR) | 2.9% | 3.2% |
| Standard Deviation (Sample) | 3.2% | 2.6% |
| Standard Deviation (Population) | 3.2% | 2.6% |
Similar Demographics by 10th Grade
Demographics Similar to Osage by 10th Grade
In terms of 10th grade, the demographic groups most similar to Osage are Creek (94.2%, a difference of 0.010%), Immigrants from Korea (94.2%, a difference of 0.010%), Immigrants from Russia (94.3%, a difference of 0.020%), Iroquois (94.3%, a difference of 0.030%), and Immigrants from Greece (94.3%, a difference of 0.030%).
| Demographics | Rating | Rank | 10th Grade |
| Israelis | 93.8 /100 | #127 | Exceptional 94.3% |
| Potawatomi | 93.6 /100 | #128 | Exceptional 94.3% |
| Iroquois | 92.8 /100 | #129 | Exceptional 94.3% |
| Immigrants | Greece | 92.7 /100 | #130 | Exceptional 94.3% |
| Immigrants | Eastern Europe | 92.5 /100 | #131 | Exceptional 94.3% |
| Immigrants | Russia | 92.4 /100 | #132 | Exceptional 94.3% |
| Creek | 91.9 /100 | #133 | Exceptional 94.2% |
| Osage | 91.7 /100 | #134 | Exceptional 94.2% |
| Immigrants | Korea | 91.3 /100 | #135 | Exceptional 94.2% |
| Shoshone | 90.8 /100 | #136 | Exceptional 94.2% |
| Arapaho | 90.5 /100 | #137 | Exceptional 94.2% |
| Immigrants | Sri Lanka | 89.9 /100 | #138 | Excellent 94.2% |
| Immigrants | Bosnia and Herzegovina | 89.4 /100 | #139 | Excellent 94.2% |
| Immigrants | Jordan | 87.6 /100 | #140 | Excellent 94.1% |
| Hmong | 86.6 /100 | #141 | Excellent 94.1% |
Demographics Similar to Immigrants from Turkey by 10th Grade
In terms of 10th grade, the demographic groups most similar to Immigrants from Turkey are Immigrants from Romania (94.5%, a difference of 0.0%), Immigrants from Serbia (94.5%, a difference of 0.0%), Immigrants from Croatia (94.5%, a difference of 0.0%), Immigrants from Europe (94.5%, a difference of 0.010%), and Cambodian (94.5%, a difference of 0.020%).
| Demographics | Rating | Rank | 10th Grade |
| Immigrants | Bulgaria | 98.1 /100 | #98 | Exceptional 94.6% |
| Immigrants | France | 97.9 /100 | #99 | Exceptional 94.5% |
| Immigrants | South Central Asia | 97.8 /100 | #100 | Exceptional 94.5% |
| Syrians | 97.7 /100 | #101 | Exceptional 94.5% |
| Cambodians | 97.6 /100 | #102 | Exceptional 94.5% |
| Immigrants | Europe | 97.5 /100 | #103 | Exceptional 94.5% |
| Immigrants | Romania | 97.5 /100 | #104 | Exceptional 94.5% |
| Immigrants | Turkey | 97.4 /100 | #105 | Exceptional 94.5% |
| Immigrants | Serbia | 97.4 /100 | #106 | Exceptional 94.5% |
| Immigrants | Croatia | 97.4 /100 | #107 | Exceptional 94.5% |
| Immigrants | North Macedonia | 97.2 /100 | #108 | Exceptional 94.5% |
| Immigrants | Norway | 97.2 /100 | #109 | Exceptional 94.5% |
| Burmese | 97.1 /100 | #110 | Exceptional 94.5% |
| Immigrants | Zimbabwe | 96.8 /100 | #111 | Exceptional 94.4% |
| Immigrants | Kuwait | 96.8 /100 | #112 | Exceptional 94.4% |