Immigrants from Taiwan vs Immigrants from Turkey 10th Grade
COMPARE
Immigrants from Taiwan
Immigrants from Turkey
10th Grade
10th Grade Comparison
Immigrants from Taiwan
Immigrants from Turkey
94.4%
10TH GRADE
95.3/ 100
METRIC RATING
120th/ 347
METRIC RANK
94.5%
10TH GRADE
97.4/ 100
METRIC RATING
105th/ 347
METRIC RANK
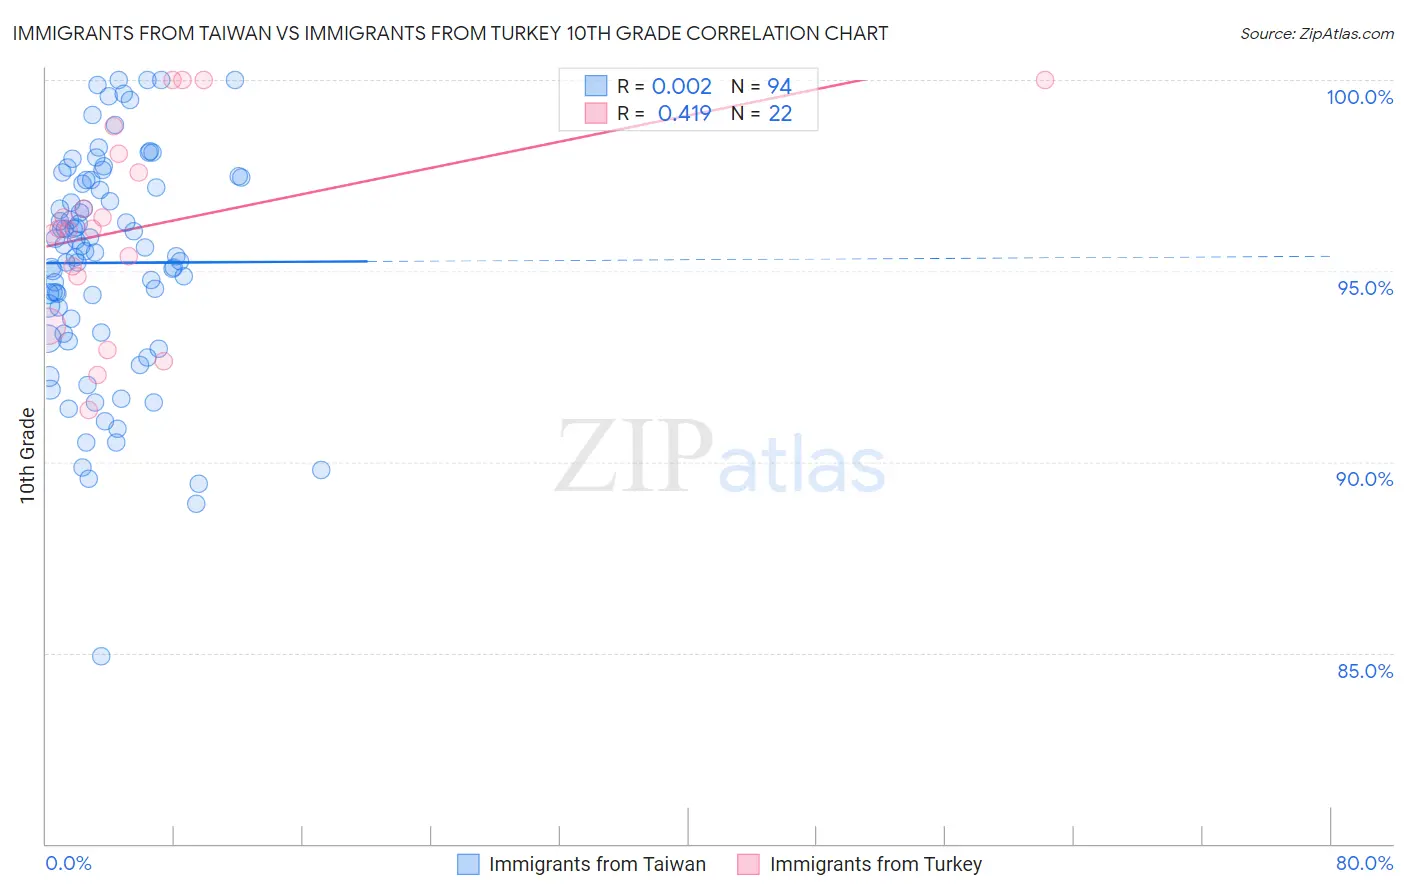
Immigrants from Taiwan vs Immigrants from Turkey 10th Grade Correlation Chart
The statistical analysis conducted on geographies consisting of 298,119,887 people shows no correlation between the proportion of Immigrants from Taiwan and percentage of population with at least 10th grade education in the United States with a correlation coefficient (R) of 0.002 and weighted average of 94.4%. Similarly, the statistical analysis conducted on geographies consisting of 223,057,877 people shows a moderate positive correlation between the proportion of Immigrants from Turkey and percentage of population with at least 10th grade education in the United States with a correlation coefficient (R) of 0.419 and weighted average of 94.5%, a difference of 0.14%.
10th Grade Correlation Summary
| Measurement | Immigrants from Taiwan | Immigrants from Turkey |
| Minimum | 84.9% | 91.4% |
| Maximum | 100.0% | 100.0% |
| Range | 15.1% | 8.6% |
| Mean | 95.2% | 96.2% |
| Median | 95.6% | 96.1% |
| Interquartile 25% (IQ1) | 93.4% | 94.9% |
| Interquartile 75% (IQ3) | 97.4% | 98.1% |
| Interquartile Range (IQR) | 4.0% | 3.2% |
| Standard Deviation (Sample) | 2.9% | 2.6% |
| Standard Deviation (Population) | 2.9% | 2.6% |
Demographics Similar to Immigrants from Taiwan and Immigrants from Turkey by 10th Grade
In terms of 10th grade, the demographic groups most similar to Immigrants from Taiwan are Jordanian (94.4%, a difference of 0.010%), Immigrants from Israel (94.4%, a difference of 0.010%), Immigrants from Belarus (94.4%, a difference of 0.010%), Inupiat (94.4%, a difference of 0.010%), and Immigrants from Hungary (94.4%, a difference of 0.030%). Similarly, the demographic groups most similar to Immigrants from Turkey are Immigrants from Romania (94.5%, a difference of 0.0%), Immigrants from Serbia (94.5%, a difference of 0.0%), Immigrants from Croatia (94.5%, a difference of 0.0%), Immigrants from Europe (94.5%, a difference of 0.010%), and Cambodian (94.5%, a difference of 0.020%).
| Demographics | Rating | Rank | 10th Grade |
| Cambodians | 97.6 /100 | #102 | Exceptional 94.5% |
| Immigrants | Europe | 97.5 /100 | #103 | Exceptional 94.5% |
| Immigrants | Romania | 97.5 /100 | #104 | Exceptional 94.5% |
| Immigrants | Turkey | 97.4 /100 | #105 | Exceptional 94.5% |
| Immigrants | Serbia | 97.4 /100 | #106 | Exceptional 94.5% |
| Immigrants | Croatia | 97.4 /100 | #107 | Exceptional 94.5% |
| Immigrants | North Macedonia | 97.2 /100 | #108 | Exceptional 94.5% |
| Immigrants | Norway | 97.2 /100 | #109 | Exceptional 94.5% |
| Burmese | 97.1 /100 | #110 | Exceptional 94.5% |
| Immigrants | Zimbabwe | 96.8 /100 | #111 | Exceptional 94.4% |
| Immigrants | Kuwait | 96.8 /100 | #112 | Exceptional 94.4% |
| Palestinians | 96.5 /100 | #113 | Exceptional 94.4% |
| German Russians | 96.3 /100 | #114 | Exceptional 94.4% |
| Delaware | 96.3 /100 | #115 | Exceptional 94.4% |
| Sioux | 96.2 /100 | #116 | Exceptional 94.4% |
| Immigrants | Hungary | 95.8 /100 | #117 | Exceptional 94.4% |
| Jordanians | 95.6 /100 | #118 | Exceptional 94.4% |
| Immigrants | Israel | 95.4 /100 | #119 | Exceptional 94.4% |
| Immigrants | Taiwan | 95.3 /100 | #120 | Exceptional 94.4% |
| Immigrants | Belarus | 95.2 /100 | #121 | Exceptional 94.4% |
| Inupiat | 95.1 /100 | #122 | Exceptional 94.4% |