Osage vs Danish 10th Grade
COMPARE
Osage
Danish
10th Grade
10th Grade Comparison
Osage
Danes
94.2%
10TH GRADE
91.7/ 100
METRIC RATING
134th/ 347
METRIC RANK
95.7%
10TH GRADE
100.0/ 100
METRIC RATING
11th/ 347
METRIC RANK
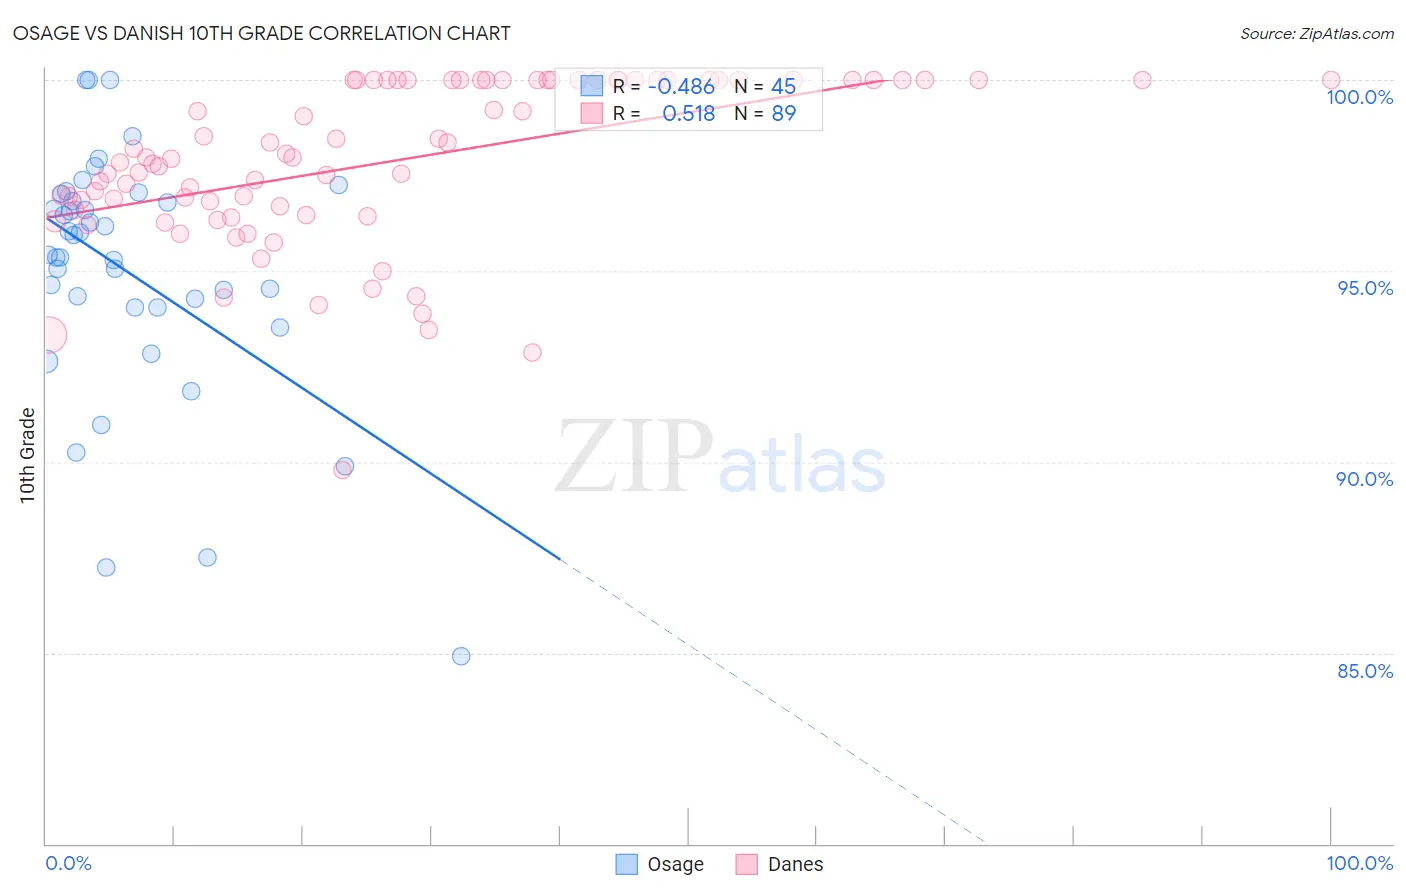
Osage vs Danish 10th Grade Correlation Chart
The statistical analysis conducted on geographies consisting of 91,808,929 people shows a moderate negative correlation between the proportion of Osage and percentage of population with at least 10th grade education in the United States with a correlation coefficient (R) of -0.486 and weighted average of 94.2%. Similarly, the statistical analysis conducted on geographies consisting of 474,193,335 people shows a substantial positive correlation between the proportion of Danes and percentage of population with at least 10th grade education in the United States with a correlation coefficient (R) of 0.518 and weighted average of 95.7%, a difference of 1.5%.
10th Grade Correlation Summary
| Measurement | Osage | Danish |
| Minimum | 84.9% | 89.8% |
| Maximum | 100.0% | 100.0% |
| Range | 15.1% | 10.2% |
| Mean | 95.0% | 97.9% |
| Median | 95.4% | 98.0% |
| Interquartile 25% (IQ1) | 94.0% | 96.5% |
| Interquartile 75% (IQ3) | 96.9% | 100.0% |
| Interquartile Range (IQR) | 2.9% | 3.5% |
| Standard Deviation (Sample) | 3.2% | 2.2% |
| Standard Deviation (Population) | 3.2% | 2.1% |
Similar Demographics by 10th Grade
Demographics Similar to Osage by 10th Grade
In terms of 10th grade, the demographic groups most similar to Osage are Creek (94.2%, a difference of 0.010%), Immigrants from Korea (94.2%, a difference of 0.010%), Immigrants from Russia (94.3%, a difference of 0.020%), Iroquois (94.3%, a difference of 0.030%), and Immigrants from Greece (94.3%, a difference of 0.030%).
| Demographics | Rating | Rank | 10th Grade |
| Israelis | 93.8 /100 | #127 | Exceptional 94.3% |
| Potawatomi | 93.6 /100 | #128 | Exceptional 94.3% |
| Iroquois | 92.8 /100 | #129 | Exceptional 94.3% |
| Immigrants | Greece | 92.7 /100 | #130 | Exceptional 94.3% |
| Immigrants | Eastern Europe | 92.5 /100 | #131 | Exceptional 94.3% |
| Immigrants | Russia | 92.4 /100 | #132 | Exceptional 94.3% |
| Creek | 91.9 /100 | #133 | Exceptional 94.2% |
| Osage | 91.7 /100 | #134 | Exceptional 94.2% |
| Immigrants | Korea | 91.3 /100 | #135 | Exceptional 94.2% |
| Shoshone | 90.8 /100 | #136 | Exceptional 94.2% |
| Arapaho | 90.5 /100 | #137 | Exceptional 94.2% |
| Immigrants | Sri Lanka | 89.9 /100 | #138 | Excellent 94.2% |
| Immigrants | Bosnia and Herzegovina | 89.4 /100 | #139 | Excellent 94.2% |
| Immigrants | Jordan | 87.6 /100 | #140 | Excellent 94.1% |
| Hmong | 86.6 /100 | #141 | Excellent 94.1% |
Demographics Similar to Danes by 10th Grade
In terms of 10th grade, the demographic groups most similar to Danes are Croatian (95.7%, a difference of 0.040%), Tlingit-Haida (95.7%, a difference of 0.040%), Finnish (95.8%, a difference of 0.060%), English (95.6%, a difference of 0.080%), and Tsimshian (95.6%, a difference of 0.090%).
| Demographics | Rating | Rank | 10th Grade |
| Swedes | 100.0 /100 | #4 | Exceptional 95.9% |
| Carpatho Rusyns | 100.0 /100 | #5 | Exceptional 95.9% |
| Poles | 100.0 /100 | #6 | Exceptional 95.8% |
| Germans | 100.0 /100 | #7 | Exceptional 95.8% |
| Lithuanians | 100.0 /100 | #8 | Exceptional 95.8% |
| Finns | 100.0 /100 | #9 | Exceptional 95.8% |
| Croatians | 100.0 /100 | #10 | Exceptional 95.7% |
| Danes | 100.0 /100 | #11 | Exceptional 95.7% |
| Tlingit-Haida | 100.0 /100 | #12 | Exceptional 95.7% |
| English | 100.0 /100 | #13 | Exceptional 95.6% |
| Tsimshian | 100.0 /100 | #14 | Exceptional 95.6% |
| Irish | 100.0 /100 | #15 | Exceptional 95.6% |
| Scottish | 100.0 /100 | #16 | Exceptional 95.6% |
| Latvians | 100.0 /100 | #17 | Exceptional 95.6% |
| Italians | 100.0 /100 | #18 | Exceptional 95.6% |