Osage vs Immigrants from Russia 1st Grade
COMPARE
Osage
Immigrants from Russia
1st Grade
1st Grade Comparison
Osage
Immigrants from Russia
98.3%
1ST GRADE
99.2/ 100
METRIC RATING
80th/ 347
METRIC RANK
97.9%
1ST GRADE
59.2/ 100
METRIC RATING
160th/ 347
METRIC RANK
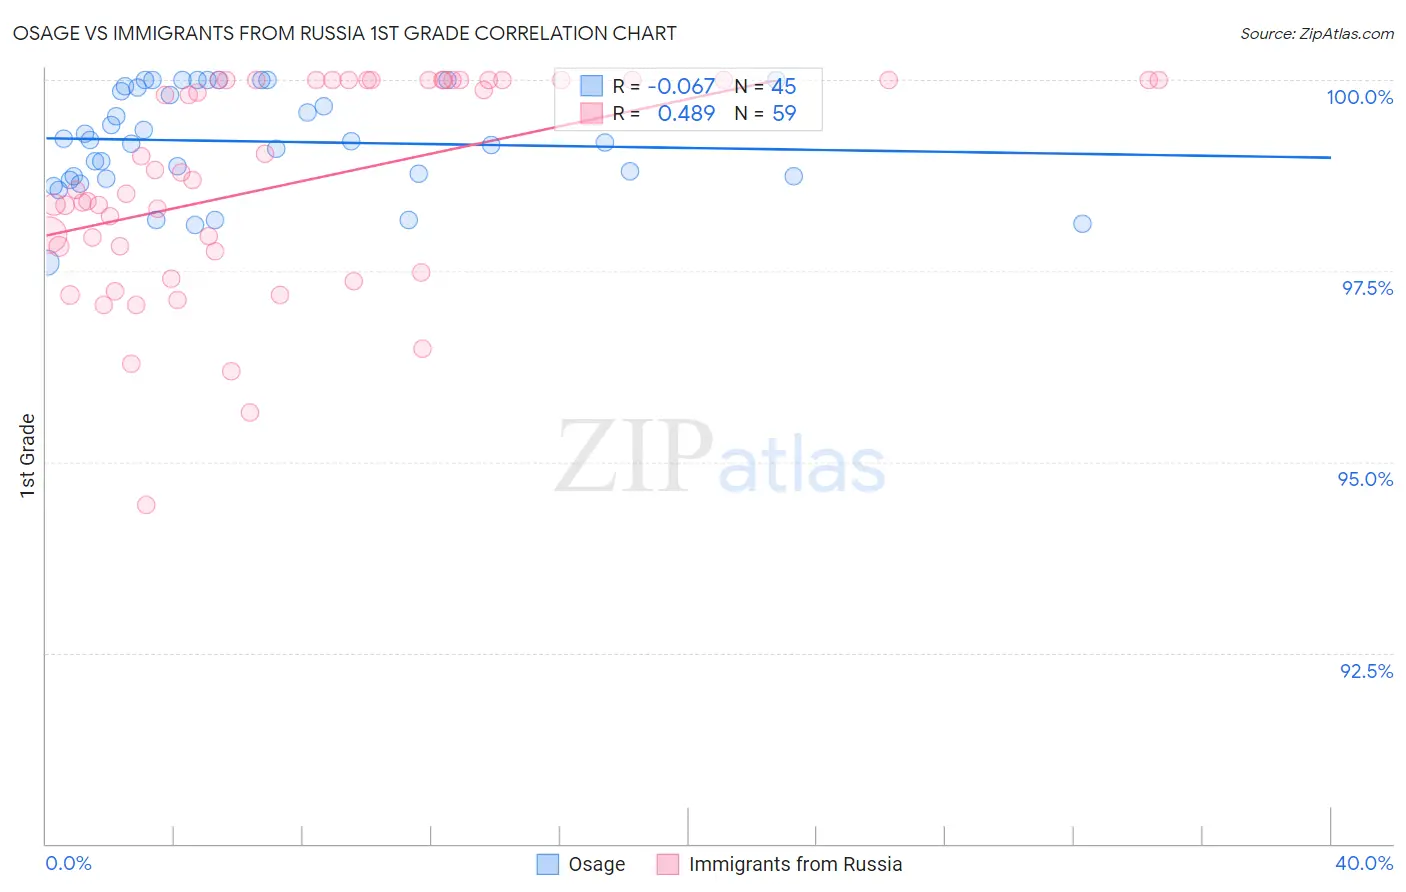
Osage vs Immigrants from Russia 1st Grade Correlation Chart
The statistical analysis conducted on geographies consisting of 91,808,929 people shows a slight negative correlation between the proportion of Osage and percentage of population with at least 1st grade education in the United States with a correlation coefficient (R) of -0.067 and weighted average of 98.3%. Similarly, the statistical analysis conducted on geographies consisting of 347,948,494 people shows a moderate positive correlation between the proportion of Immigrants from Russia and percentage of population with at least 1st grade education in the United States with a correlation coefficient (R) of 0.489 and weighted average of 97.9%, a difference of 0.34%.
1st Grade Correlation Summary
| Measurement | Osage | Immigrants from Russia |
| Minimum | 97.6% | 94.4% |
| Maximum | 100.0% | 100.0% |
| Range | 2.4% | 5.6% |
| Mean | 99.2% | 98.7% |
| Median | 99.2% | 98.7% |
| Interquartile 25% (IQ1) | 98.7% | 97.8% |
| Interquartile 75% (IQ3) | 99.9% | 100.0% |
| Interquartile Range (IQR) | 1.2% | 2.2% |
| Standard Deviation (Sample) | 0.66% | 1.4% |
| Standard Deviation (Population) | 0.66% | 1.4% |
Similar Demographics by 1st Grade
Demographics Similar to Osage by 1st Grade
In terms of 1st grade, the demographic groups most similar to Osage are Immigrants from Lithuania (98.3%, a difference of 0.0%), Potawatomi (98.3%, a difference of 0.0%), Icelander (98.3%, a difference of 0.0%), Immigrants from England (98.3%, a difference of 0.010%), and Immigrants from Belgium (98.3%, a difference of 0.010%).
| Demographics | Rating | Rank | 1st Grade |
| Cajuns | 99.5 /100 | #73 | Exceptional 98.3% |
| Immigrants | Netherlands | 99.4 /100 | #74 | Exceptional 98.3% |
| Cherokee | 99.3 /100 | #75 | Exceptional 98.3% |
| Shoshone | 99.3 /100 | #76 | Exceptional 98.3% |
| Immigrants | England | 99.3 /100 | #77 | Exceptional 98.3% |
| Immigrants | Belgium | 99.2 /100 | #78 | Exceptional 98.3% |
| Immigrants | Lithuania | 99.2 /100 | #79 | Exceptional 98.3% |
| Osage | 99.2 /100 | #80 | Exceptional 98.3% |
| Potawatomi | 99.1 /100 | #81 | Exceptional 98.3% |
| Icelanders | 99.1 /100 | #82 | Exceptional 98.3% |
| Immigrants | Sweden | 99.1 /100 | #83 | Exceptional 98.3% |
| Delaware | 99.1 /100 | #84 | Exceptional 98.3% |
| Hopi | 99.0 /100 | #85 | Exceptional 98.3% |
| Immigrants | Denmark | 99.0 /100 | #86 | Exceptional 98.3% |
| Immigrants | Australia | 99.0 /100 | #87 | Exceptional 98.3% |
Demographics Similar to Immigrants from Russia by 1st Grade
In terms of 1st grade, the demographic groups most similar to Immigrants from Russia are Immigrants from Italy (97.9%, a difference of 0.0%), Immigrants from Eastern Europe (97.9%, a difference of 0.0%), Spanish American (97.9%, a difference of 0.0%), Brazilian (97.9%, a difference of 0.010%), and Ugandan (97.9%, a difference of 0.010%).
| Demographics | Rating | Rank | 1st Grade |
| Soviet Union | 68.9 /100 | #153 | Good 98.0% |
| Immigrants | Iran | 66.9 /100 | #154 | Good 98.0% |
| Comanche | 66.9 /100 | #155 | Good 98.0% |
| Immigrants | South Central Asia | 66.2 /100 | #156 | Good 98.0% |
| Immigrants | North Macedonia | 65.3 /100 | #157 | Good 98.0% |
| Venezuelans | 64.7 /100 | #158 | Good 98.0% |
| French American Indians | 63.7 /100 | #159 | Good 98.0% |
| Immigrants | Russia | 59.2 /100 | #160 | Average 97.9% |
| Immigrants | Italy | 59.1 /100 | #161 | Average 97.9% |
| Immigrants | Eastern Europe | 58.9 /100 | #162 | Average 97.9% |
| Spanish Americans | 57.7 /100 | #163 | Average 97.9% |
| Brazilians | 57.6 /100 | #164 | Average 97.9% |
| Ugandans | 56.9 /100 | #165 | Average 97.9% |
| Navajo | 56.6 /100 | #166 | Average 97.9% |
| Bermudans | 56.3 /100 | #167 | Average 97.9% |