Osage vs Nonimmigrants 3rd Grade
COMPARE
Osage
Nonimmigrants
3rd Grade
3rd Grade Comparison
Osage
Nonimmigrants
98.2%
3RD GRADE
99.2/ 100
METRIC RATING
78th/ 347
METRIC RANK
98.1%
3RD GRADE
97.8/ 100
METRIC RATING
102nd/ 347
METRIC RANK
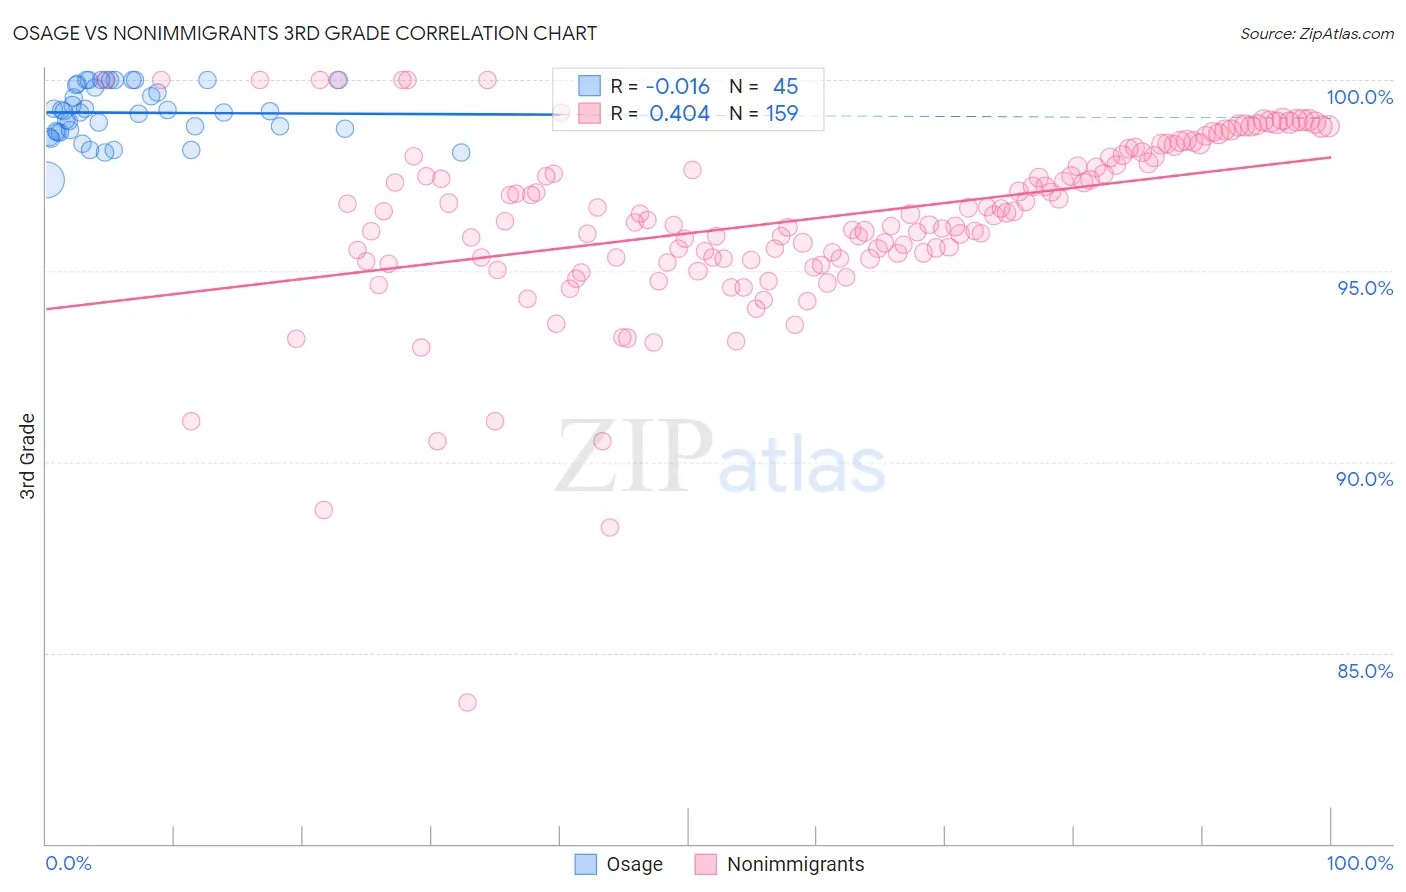
Osage vs Nonimmigrants 3rd Grade Correlation Chart
The statistical analysis conducted on geographies consisting of 91,808,929 people shows no correlation between the proportion of Osage and percentage of population with at least 3rd grade education in the United States with a correlation coefficient (R) of -0.016 and weighted average of 98.2%. Similarly, the statistical analysis conducted on geographies consisting of 585,374,774 people shows a moderate positive correlation between the proportion of Nonimmigrants and percentage of population with at least 3rd grade education in the United States with a correlation coefficient (R) of 0.404 and weighted average of 98.1%, a difference of 0.080%.
3rd Grade Correlation Summary
| Measurement | Osage | Nonimmigrants |
| Minimum | 97.4% | 83.7% |
| Maximum | 100.0% | 100.0% |
| Range | 2.6% | 16.3% |
| Mean | 99.1% | 96.4% |
| Median | 99.2% | 96.5% |
| Interquartile 25% (IQ1) | 98.6% | 95.3% |
| Interquartile 75% (IQ3) | 99.9% | 98.0% |
| Interquartile Range (IQR) | 1.2% | 2.7% |
| Standard Deviation (Sample) | 0.69% | 2.3% |
| Standard Deviation (Population) | 0.68% | 2.3% |
Similar Demographics by 3rd Grade
Demographics Similar to Osage by 3rd Grade
In terms of 3rd grade, the demographic groups most similar to Osage are Immigrants from Netherlands (98.2%, a difference of 0.010%), Cherokee (98.2%, a difference of 0.010%), Immigrants from England (98.2%, a difference of 0.010%), Immigrants from Lithuania (98.2%, a difference of 0.010%), and Immigrants from Belgium (98.1%, a difference of 0.010%).
| Demographics | Rating | Rank | 3rd Grade |
| Immigrants | Austria | 99.6 /100 | #71 | Exceptional 98.2% |
| Chickasaw | 99.5 /100 | #72 | Exceptional 98.2% |
| Cheyenne | 99.3 /100 | #73 | Exceptional 98.2% |
| Immigrants | Netherlands | 99.3 /100 | #74 | Exceptional 98.2% |
| Cherokee | 99.3 /100 | #75 | Exceptional 98.2% |
| Immigrants | England | 99.2 /100 | #76 | Exceptional 98.2% |
| Immigrants | Lithuania | 99.2 /100 | #77 | Exceptional 98.2% |
| Osage | 99.2 /100 | #78 | Exceptional 98.2% |
| Immigrants | Belgium | 99.1 /100 | #79 | Exceptional 98.1% |
| Macedonians | 99.1 /100 | #80 | Exceptional 98.1% |
| Icelanders | 99.1 /100 | #81 | Exceptional 98.1% |
| Shoshone | 99.0 /100 | #82 | Exceptional 98.1% |
| Ukrainians | 98.9 /100 | #83 | Exceptional 98.1% |
| Immigrants | Sweden | 98.9 /100 | #84 | Exceptional 98.1% |
| Immigrants | Australia | 98.9 /100 | #85 | Exceptional 98.1% |
Demographics Similar to Nonimmigrants by 3rd Grade
In terms of 3rd grade, the demographic groups most similar to Nonimmigrants are Cree (98.1%, a difference of 0.0%), Puget Sound Salish (98.1%, a difference of 0.0%), South African (98.1%, a difference of 0.010%), Choctaw (98.1%, a difference of 0.010%), and Romanian (98.1%, a difference of 0.010%).
| Demographics | Rating | Rank | 3rd Grade |
| Cypriots | 98.4 /100 | #95 | Exceptional 98.1% |
| Immigrants | Ireland | 98.2 /100 | #96 | Exceptional 98.1% |
| South Africans | 98.2 /100 | #97 | Exceptional 98.1% |
| Choctaw | 98.0 /100 | #98 | Exceptional 98.1% |
| Romanians | 98.0 /100 | #99 | Exceptional 98.1% |
| Cree | 97.9 /100 | #100 | Exceptional 98.1% |
| Puget Sound Salish | 97.9 /100 | #101 | Exceptional 98.1% |
| Immigrants | Nonimmigrants | 97.8 /100 | #102 | Exceptional 98.1% |
| Yugoslavians | 97.7 /100 | #103 | Exceptional 98.1% |
| Turks | 97.6 /100 | #104 | Exceptional 98.1% |
| German Russians | 97.2 /100 | #105 | Exceptional 98.1% |
| Bhutanese | 97.2 /100 | #106 | Exceptional 98.1% |
| Immigrants | Czechoslovakia | 97.0 /100 | #107 | Exceptional 98.0% |
| Immigrants | Singapore | 96.7 /100 | #108 | Exceptional 98.0% |
| Pima | 96.7 /100 | #109 | Exceptional 98.0% |