Osage vs Cajun Nursery School
COMPARE
Osage
Cajun
Nursery School
Nursery School Comparison
Osage
Cajuns
98.3%
NURSERY SCHOOL
99.1/ 100
METRIC RATING
83rd/ 347
METRIC RANK
98.4%
NURSERY SCHOOL
99.4/ 100
METRIC RATING
73rd/ 347
METRIC RANK
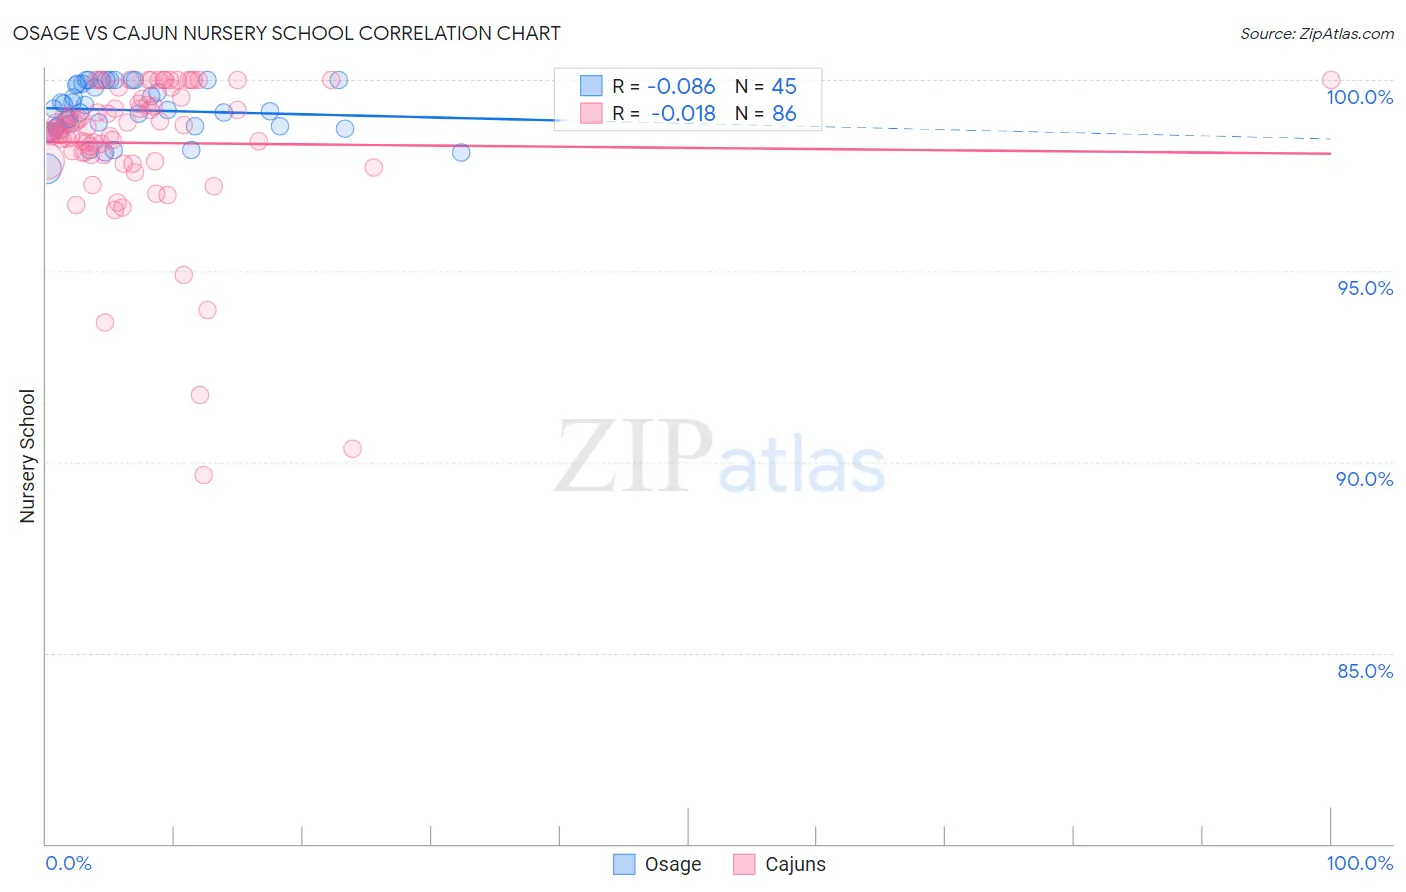
Osage vs Cajun Nursery School Correlation Chart
The statistical analysis conducted on geographies consisting of 91,808,929 people shows a slight negative correlation between the proportion of Osage and percentage of population with at least nursery school education in the United States with a correlation coefficient (R) of -0.086 and weighted average of 98.3%. Similarly, the statistical analysis conducted on geographies consisting of 149,712,957 people shows no correlation between the proportion of Cajuns and percentage of population with at least nursery school education in the United States with a correlation coefficient (R) of -0.018 and weighted average of 98.4%, a difference of 0.030%.
Nursery School Correlation Summary
| Measurement | Osage | Cajun |
| Minimum | 97.7% | 89.7% |
| Maximum | 100.0% | 100.0% |
| Range | 2.3% | 10.3% |
| Mean | 99.2% | 98.4% |
| Median | 99.2% | 98.7% |
| Interquartile 25% (IQ1) | 98.8% | 98.1% |
| Interquartile 75% (IQ3) | 99.9% | 99.5% |
| Interquartile Range (IQR) | 1.1% | 1.5% |
| Standard Deviation (Sample) | 0.66% | 1.9% |
| Standard Deviation (Population) | 0.65% | 1.9% |
Demographics Similar to Osage and Cajuns by Nursery School
In terms of nursery school, the demographic groups most similar to Osage are Immigrants from Denmark (98.3%, a difference of 0.0%), Immigrants from Sweden (98.3%, a difference of 0.0%), Immigrants from Belgium (98.3%, a difference of 0.010%), Shoshone (98.3%, a difference of 0.010%), and Icelander (98.3%, a difference of 0.010%). Similarly, the demographic groups most similar to Cajuns are Immigrants from Netherlands (98.4%, a difference of 0.0%), Cherokee (98.3%, a difference of 0.010%), Immigrants from England (98.3%, a difference of 0.010%), Immigrants from Lithuania (98.3%, a difference of 0.010%), and Delaware (98.3%, a difference of 0.010%).
| Demographics | Rating | Rank | Nursery School |
| Russians | 99.6 /100 | #68 | Exceptional 98.4% |
| Immigrants | Austria | 99.6 /100 | #69 | Exceptional 98.4% |
| Cheyenne | 99.6 /100 | #70 | Exceptional 98.4% |
| Serbians | 99.6 /100 | #71 | Exceptional 98.4% |
| Chickasaw | 99.6 /100 | #72 | Exceptional 98.4% |
| Cajuns | 99.4 /100 | #73 | Exceptional 98.4% |
| Immigrants | Netherlands | 99.4 /100 | #74 | Exceptional 98.4% |
| Cherokee | 99.3 /100 | #75 | Exceptional 98.3% |
| Immigrants | England | 99.3 /100 | #76 | Exceptional 98.3% |
| Immigrants | Lithuania | 99.3 /100 | #77 | Exceptional 98.3% |
| Delaware | 99.3 /100 | #78 | Exceptional 98.3% |
| Immigrants | Belgium | 99.3 /100 | #79 | Exceptional 98.3% |
| Shoshone | 99.3 /100 | #80 | Exceptional 98.3% |
| Icelanders | 99.2 /100 | #81 | Exceptional 98.3% |
| Potawatomi | 99.2 /100 | #82 | Exceptional 98.3% |
| Osage | 99.1 /100 | #83 | Exceptional 98.3% |
| Immigrants | Denmark | 99.1 /100 | #84 | Exceptional 98.3% |
| Immigrants | Sweden | 99.1 /100 | #85 | Exceptional 98.3% |
| Immigrants | Australia | 99.0 /100 | #86 | Exceptional 98.3% |
| Hopi | 98.9 /100 | #87 | Exceptional 98.3% |
| Ukrainians | 98.9 /100 | #88 | Exceptional 98.3% |