Haitian vs Cajun Nursery School
COMPARE
Haitian
Cajun
Nursery School
Nursery School Comparison
Haitians
Cajuns
97.2%
NURSERY SCHOOL
0.0/ 100
METRIC RATING
300th/ 347
METRIC RANK
98.4%
NURSERY SCHOOL
99.4/ 100
METRIC RATING
73rd/ 347
METRIC RANK
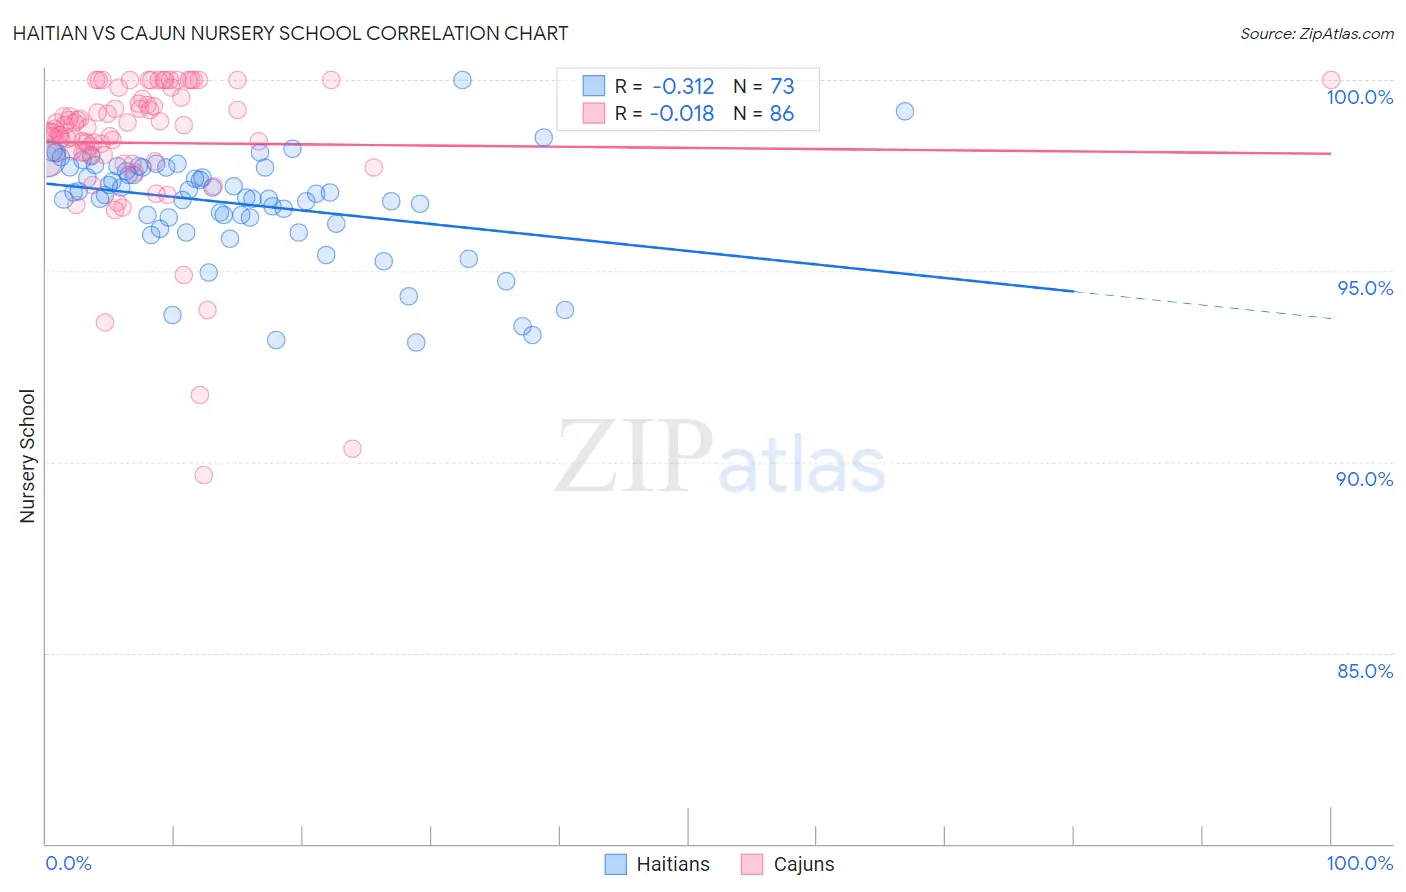
Haitian vs Cajun Nursery School Correlation Chart
The statistical analysis conducted on geographies consisting of 288,018,638 people shows a mild negative correlation between the proportion of Haitians and percentage of population with at least nursery school education in the United States with a correlation coefficient (R) of -0.312 and weighted average of 97.2%. Similarly, the statistical analysis conducted on geographies consisting of 149,712,957 people shows no correlation between the proportion of Cajuns and percentage of population with at least nursery school education in the United States with a correlation coefficient (R) of -0.018 and weighted average of 98.4%, a difference of 1.2%.
Nursery School Correlation Summary
| Measurement | Haitian | Cajun |
| Minimum | 93.1% | 89.7% |
| Maximum | 100.0% | 100.0% |
| Range | 6.9% | 10.3% |
| Mean | 96.8% | 98.4% |
| Median | 97.0% | 98.7% |
| Interquartile 25% (IQ1) | 96.3% | 98.1% |
| Interquartile 75% (IQ3) | 97.7% | 99.5% |
| Interquartile Range (IQR) | 1.4% | 1.5% |
| Standard Deviation (Sample) | 1.4% | 1.9% |
| Standard Deviation (Population) | 1.4% | 1.9% |
Similar Demographics by Nursery School
Demographics Similar to Haitians by Nursery School
In terms of nursery school, the demographic groups most similar to Haitians are Immigrants from Dominica (97.2%, a difference of 0.010%), Central American Indian (97.2%, a difference of 0.020%), Immigrants from Cuba (97.2%, a difference of 0.030%), Immigrants from South Eastern Asia (97.1%, a difference of 0.030%), and Immigrants from Caribbean (97.1%, a difference of 0.060%).
| Demographics | Rating | Rank | Nursery School |
| Malaysians | 0.0 /100 | #293 | Tragic 97.3% |
| Immigrants | Grenada | 0.0 /100 | #294 | Tragic 97.3% |
| Immigrants | Immigrants | 0.0 /100 | #295 | Tragic 97.2% |
| Immigrants | Eritrea | 0.0 /100 | #296 | Tragic 97.2% |
| Immigrants | Cuba | 0.0 /100 | #297 | Tragic 97.2% |
| Central American Indians | 0.0 /100 | #298 | Tragic 97.2% |
| Immigrants | Dominica | 0.0 /100 | #299 | Tragic 97.2% |
| Haitians | 0.0 /100 | #300 | Tragic 97.2% |
| Immigrants | South Eastern Asia | 0.0 /100 | #301 | Tragic 97.1% |
| Immigrants | Caribbean | 0.0 /100 | #302 | Tragic 97.1% |
| Nicaraguans | 0.0 /100 | #303 | Tragic 97.1% |
| Ecuadorians | 0.0 /100 | #304 | Tragic 97.1% |
| Somalis | 0.0 /100 | #305 | Tragic 97.1% |
| Belizeans | 0.0 /100 | #306 | Tragic 97.0% |
| Hispanics or Latinos | 0.0 /100 | #307 | Tragic 97.0% |
Demographics Similar to Cajuns by Nursery School
In terms of nursery school, the demographic groups most similar to Cajuns are Immigrants from Netherlands (98.4%, a difference of 0.0%), Cherokee (98.3%, a difference of 0.010%), Immigrants from England (98.3%, a difference of 0.010%), Immigrants from Lithuania (98.3%, a difference of 0.010%), and Delaware (98.3%, a difference of 0.010%).
| Demographics | Rating | Rank | Nursery School |
| Canadians | 99.7 /100 | #66 | Exceptional 98.4% |
| Immigrants | Northern Europe | 99.6 /100 | #67 | Exceptional 98.4% |
| Russians | 99.6 /100 | #68 | Exceptional 98.4% |
| Immigrants | Austria | 99.6 /100 | #69 | Exceptional 98.4% |
| Cheyenne | 99.6 /100 | #70 | Exceptional 98.4% |
| Serbians | 99.6 /100 | #71 | Exceptional 98.4% |
| Chickasaw | 99.6 /100 | #72 | Exceptional 98.4% |
| Cajuns | 99.4 /100 | #73 | Exceptional 98.4% |
| Immigrants | Netherlands | 99.4 /100 | #74 | Exceptional 98.4% |
| Cherokee | 99.3 /100 | #75 | Exceptional 98.3% |
| Immigrants | England | 99.3 /100 | #76 | Exceptional 98.3% |
| Immigrants | Lithuania | 99.3 /100 | #77 | Exceptional 98.3% |
| Delaware | 99.3 /100 | #78 | Exceptional 98.3% |
| Immigrants | Belgium | 99.3 /100 | #79 | Exceptional 98.3% |
| Shoshone | 99.3 /100 | #80 | Exceptional 98.3% |