Osage vs French Canadian Nursery School
COMPARE
Osage
French Canadian
Nursery School
Nursery School Comparison
Osage
French Canadians
98.3%
NURSERY SCHOOL
99.1/ 100
METRIC RATING
83rd/ 347
METRIC RANK
98.6%
NURSERY SCHOOL
100.0/ 100
METRIC RATING
32nd/ 347
METRIC RANK
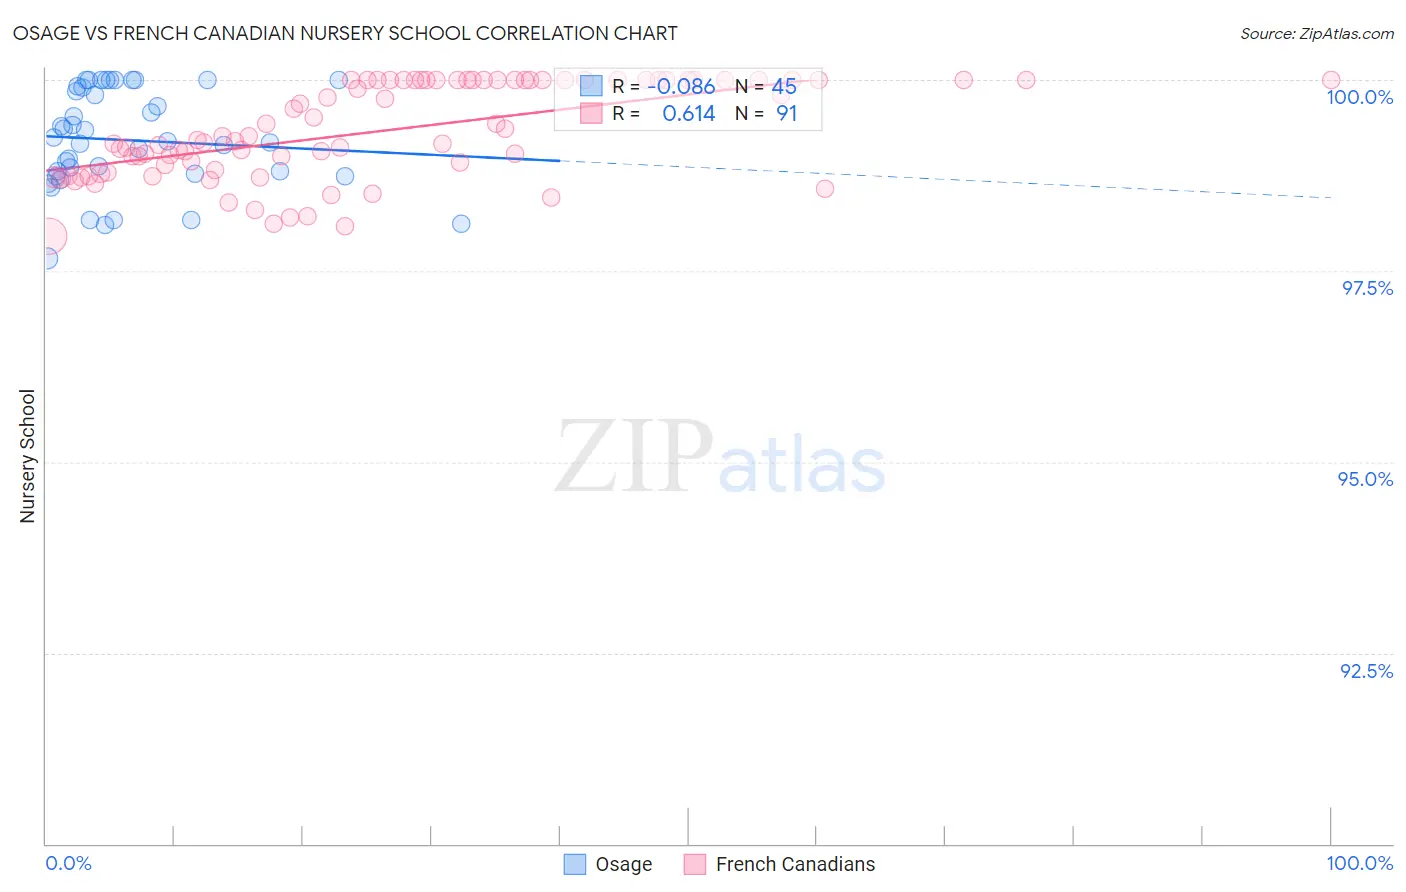
Osage vs French Canadian Nursery School Correlation Chart
The statistical analysis conducted on geographies consisting of 91,808,929 people shows a slight negative correlation between the proportion of Osage and percentage of population with at least nursery school education in the United States with a correlation coefficient (R) of -0.086 and weighted average of 98.3%. Similarly, the statistical analysis conducted on geographies consisting of 502,680,117 people shows a significant positive correlation between the proportion of French Canadians and percentage of population with at least nursery school education in the United States with a correlation coefficient (R) of 0.614 and weighted average of 98.6%, a difference of 0.26%.
Nursery School Correlation Summary
| Measurement | Osage | French Canadian |
| Minimum | 97.7% | 98.0% |
| Maximum | 100.0% | 100.0% |
| Range | 2.3% | 2.0% |
| Mean | 99.2% | 99.3% |
| Median | 99.2% | 99.2% |
| Interquartile 25% (IQ1) | 98.8% | 98.8% |
| Interquartile 75% (IQ3) | 99.9% | 100.0% |
| Interquartile Range (IQR) | 1.1% | 1.2% |
| Standard Deviation (Sample) | 0.66% | 0.62% |
| Standard Deviation (Population) | 0.65% | 0.61% |
Similar Demographics by Nursery School
Demographics Similar to Osage by Nursery School
In terms of nursery school, the demographic groups most similar to Osage are Immigrants from Denmark (98.3%, a difference of 0.0%), Immigrants from Sweden (98.3%, a difference of 0.0%), Immigrants from Belgium (98.3%, a difference of 0.010%), Shoshone (98.3%, a difference of 0.010%), and Icelander (98.3%, a difference of 0.010%).
| Demographics | Rating | Rank | Nursery School |
| Immigrants | England | 99.3 /100 | #76 | Exceptional 98.3% |
| Immigrants | Lithuania | 99.3 /100 | #77 | Exceptional 98.3% |
| Delaware | 99.3 /100 | #78 | Exceptional 98.3% |
| Immigrants | Belgium | 99.3 /100 | #79 | Exceptional 98.3% |
| Shoshone | 99.3 /100 | #80 | Exceptional 98.3% |
| Icelanders | 99.2 /100 | #81 | Exceptional 98.3% |
| Potawatomi | 99.2 /100 | #82 | Exceptional 98.3% |
| Osage | 99.1 /100 | #83 | Exceptional 98.3% |
| Immigrants | Denmark | 99.1 /100 | #84 | Exceptional 98.3% |
| Immigrants | Sweden | 99.1 /100 | #85 | Exceptional 98.3% |
| Immigrants | Australia | 99.0 /100 | #86 | Exceptional 98.3% |
| Hopi | 98.9 /100 | #87 | Exceptional 98.3% |
| Ukrainians | 98.9 /100 | #88 | Exceptional 98.3% |
| Immigrants | South Africa | 98.8 /100 | #89 | Exceptional 98.3% |
| Immigrants | Western Europe | 98.8 /100 | #90 | Exceptional 98.3% |
Demographics Similar to French Canadians by Nursery School
In terms of nursery school, the demographic groups most similar to French Canadians are European (98.6%, a difference of 0.0%), Czech (98.6%, a difference of 0.0%), French (98.6%, a difference of 0.010%), Scandinavian (98.6%, a difference of 0.010%), and Croatian (98.6%, a difference of 0.020%).
| Demographics | Rating | Rank | Nursery School |
| Scotch-Irish | 100.0 /100 | #25 | Exceptional 98.6% |
| Sioux | 100.0 /100 | #26 | Exceptional 98.6% |
| Arapaho | 100.0 /100 | #27 | Exceptional 98.6% |
| Croatians | 100.0 /100 | #28 | Exceptional 98.6% |
| French | 100.0 /100 | #29 | Exceptional 98.6% |
| Europeans | 100.0 /100 | #30 | Exceptional 98.6% |
| Czechs | 100.0 /100 | #31 | Exceptional 98.6% |
| French Canadians | 100.0 /100 | #32 | Exceptional 98.6% |
| Scandinavians | 100.0 /100 | #33 | Exceptional 98.6% |
| Chinese | 100.0 /100 | #34 | Exceptional 98.6% |
| Swiss | 100.0 /100 | #35 | Exceptional 98.6% |
| British | 100.0 /100 | #36 | Exceptional 98.5% |
| Lumbee | 99.9 /100 | #37 | Exceptional 98.5% |
| Italians | 99.9 /100 | #38 | Exceptional 98.5% |
| Latvians | 99.9 /100 | #39 | Exceptional 98.5% |