Norwegian vs Latvian 1st Grade
COMPARE
Norwegian
Latvian
1st Grade
1st Grade Comparison
Norwegians
Latvians
98.7%
1ST GRADE
100.0/ 100
METRIC RATING
8th/ 347
METRIC RANK
98.5%
1ST GRADE
99.9/ 100
METRIC RATING
39th/ 347
METRIC RANK
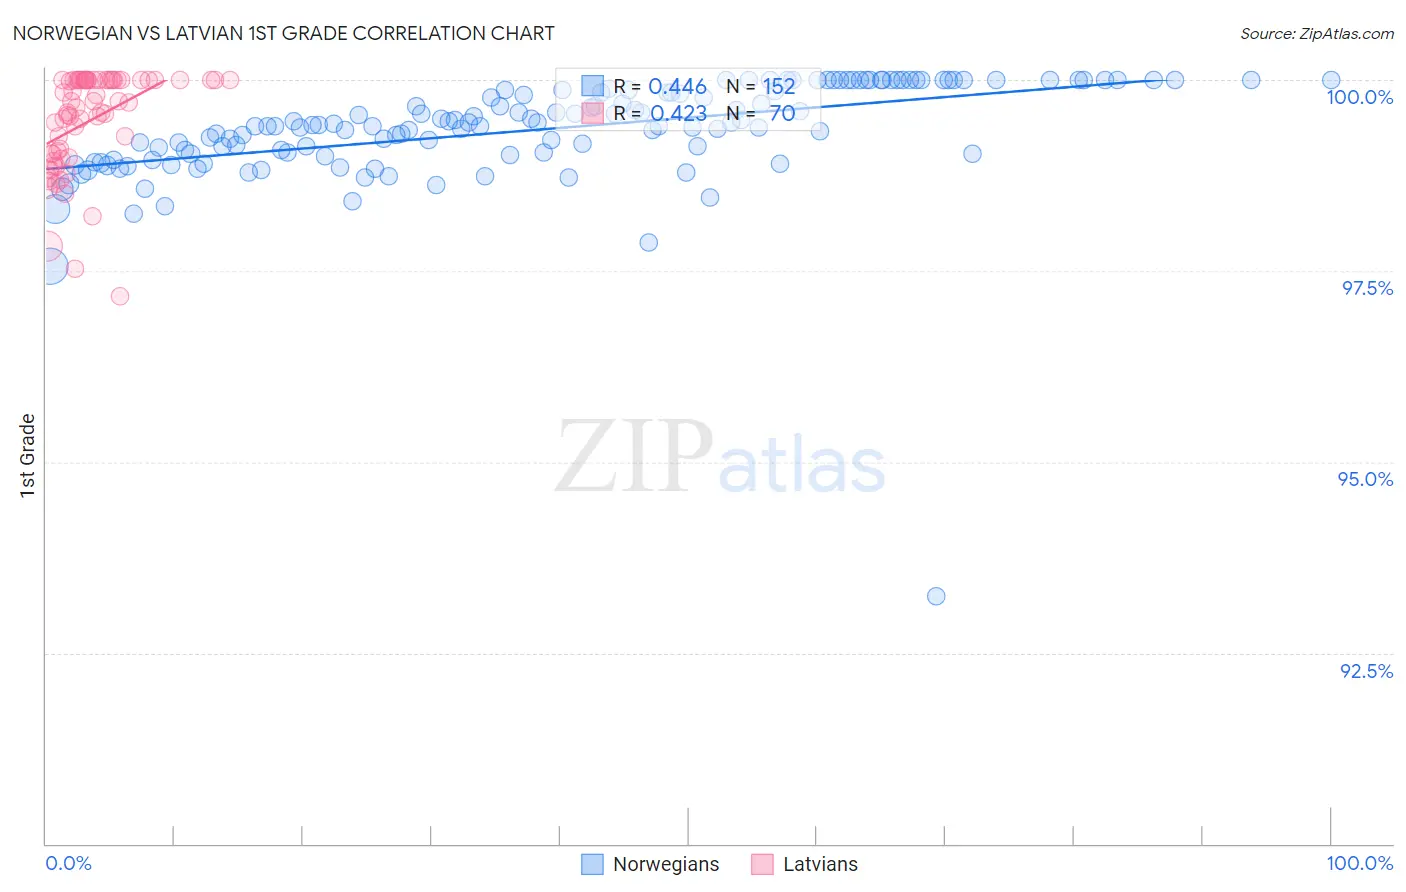
Norwegian vs Latvian 1st Grade Correlation Chart
The statistical analysis conducted on geographies consisting of 533,395,488 people shows a moderate positive correlation between the proportion of Norwegians and percentage of population with at least 1st grade education in the United States with a correlation coefficient (R) of 0.446 and weighted average of 98.7%. Similarly, the statistical analysis conducted on geographies consisting of 220,726,452 people shows a moderate positive correlation between the proportion of Latvians and percentage of population with at least 1st grade education in the United States with a correlation coefficient (R) of 0.423 and weighted average of 98.5%, a difference of 0.23%.
1st Grade Correlation Summary
| Measurement | Norwegian | Latvian |
| Minimum | 93.2% | 97.2% |
| Maximum | 100.0% | 100.0% |
| Range | 6.8% | 2.8% |
| Mean | 99.4% | 99.5% |
| Median | 99.4% | 99.7% |
| Interquartile 25% (IQ1) | 99.0% | 99.0% |
| Interquartile 75% (IQ3) | 99.9% | 100.0% |
| Interquartile Range (IQR) | 0.83% | 0.97% |
| Standard Deviation (Sample) | 0.71% | 0.65% |
| Standard Deviation (Population) | 0.71% | 0.65% |
Similar Demographics by 1st Grade
Demographics Similar to Norwegians by 1st Grade
In terms of 1st grade, the demographic groups most similar to Norwegians are Alaska Native (98.7%, a difference of 0.020%), Slovak (98.7%, a difference of 0.020%), German (98.7%, a difference of 0.020%), Tlingit-Haida (98.7%, a difference of 0.030%), and Slovene (98.7%, a difference of 0.040%).
| Demographics | Rating | Rank | 1st Grade |
| Crow | 100.0 /100 | #1 | Exceptional 99.6% |
| Yup'ik | 100.0 /100 | #2 | Exceptional 99.2% |
| Inupiat | 100.0 /100 | #3 | Exceptional 98.9% |
| Welsh | 100.0 /100 | #4 | Exceptional 98.9% |
| Tsimshian | 100.0 /100 | #5 | Exceptional 98.8% |
| Alaskan Athabascans | 100.0 /100 | #6 | Exceptional 98.8% |
| Alaska Natives | 100.0 /100 | #7 | Exceptional 98.7% |
| Norwegians | 100.0 /100 | #8 | Exceptional 98.7% |
| Slovaks | 100.0 /100 | #9 | Exceptional 98.7% |
| Germans | 100.0 /100 | #10 | Exceptional 98.7% |
| Tlingit-Haida | 100.0 /100 | #11 | Exceptional 98.7% |
| Slovenes | 100.0 /100 | #12 | Exceptional 98.7% |
| Carpatho Rusyns | 100.0 /100 | #13 | Exceptional 98.6% |
| English | 100.0 /100 | #14 | Exceptional 98.6% |
| Swedes | 100.0 /100 | #15 | Exceptional 98.6% |
Demographics Similar to Latvians by 1st Grade
In terms of 1st grade, the demographic groups most similar to Latvians are Chippewa (98.5%, a difference of 0.0%), Italian (98.5%, a difference of 0.010%), Luxembourger (98.5%, a difference of 0.010%), Eastern European (98.5%, a difference of 0.010%), and Native Hawaiian (98.5%, a difference of 0.020%).
| Demographics | Rating | Rank | 1st Grade |
| French Canadians | 100.0 /100 | #32 | Exceptional 98.5% |
| Scandinavians | 100.0 /100 | #33 | Exceptional 98.5% |
| Swiss | 100.0 /100 | #34 | Exceptional 98.5% |
| Chinese | 100.0 /100 | #35 | Exceptional 98.5% |
| British | 100.0 /100 | #36 | Exceptional 98.5% |
| Italians | 99.9 /100 | #37 | Exceptional 98.5% |
| Chippewa | 99.9 /100 | #38 | Exceptional 98.5% |
| Latvians | 99.9 /100 | #39 | Exceptional 98.5% |
| Luxembourgers | 99.9 /100 | #40 | Exceptional 98.5% |
| Eastern Europeans | 99.9 /100 | #41 | Exceptional 98.5% |
| Native Hawaiians | 99.9 /100 | #42 | Exceptional 98.5% |
| Lumbee | 99.9 /100 | #43 | Exceptional 98.5% |
| Northern Europeans | 99.9 /100 | #44 | Exceptional 98.5% |
| Belgians | 99.9 /100 | #45 | Exceptional 98.4% |
| Hungarians | 99.9 /100 | #46 | Exceptional 98.4% |