Canadian vs Latvian 1st Grade
COMPARE
Canadian
Latvian
1st Grade
1st Grade Comparison
Canadians
Latvians
98.3%
1ST GRADE
99.6/ 100
METRIC RATING
66th/ 347
METRIC RANK
98.5%
1ST GRADE
99.9/ 100
METRIC RATING
39th/ 347
METRIC RANK
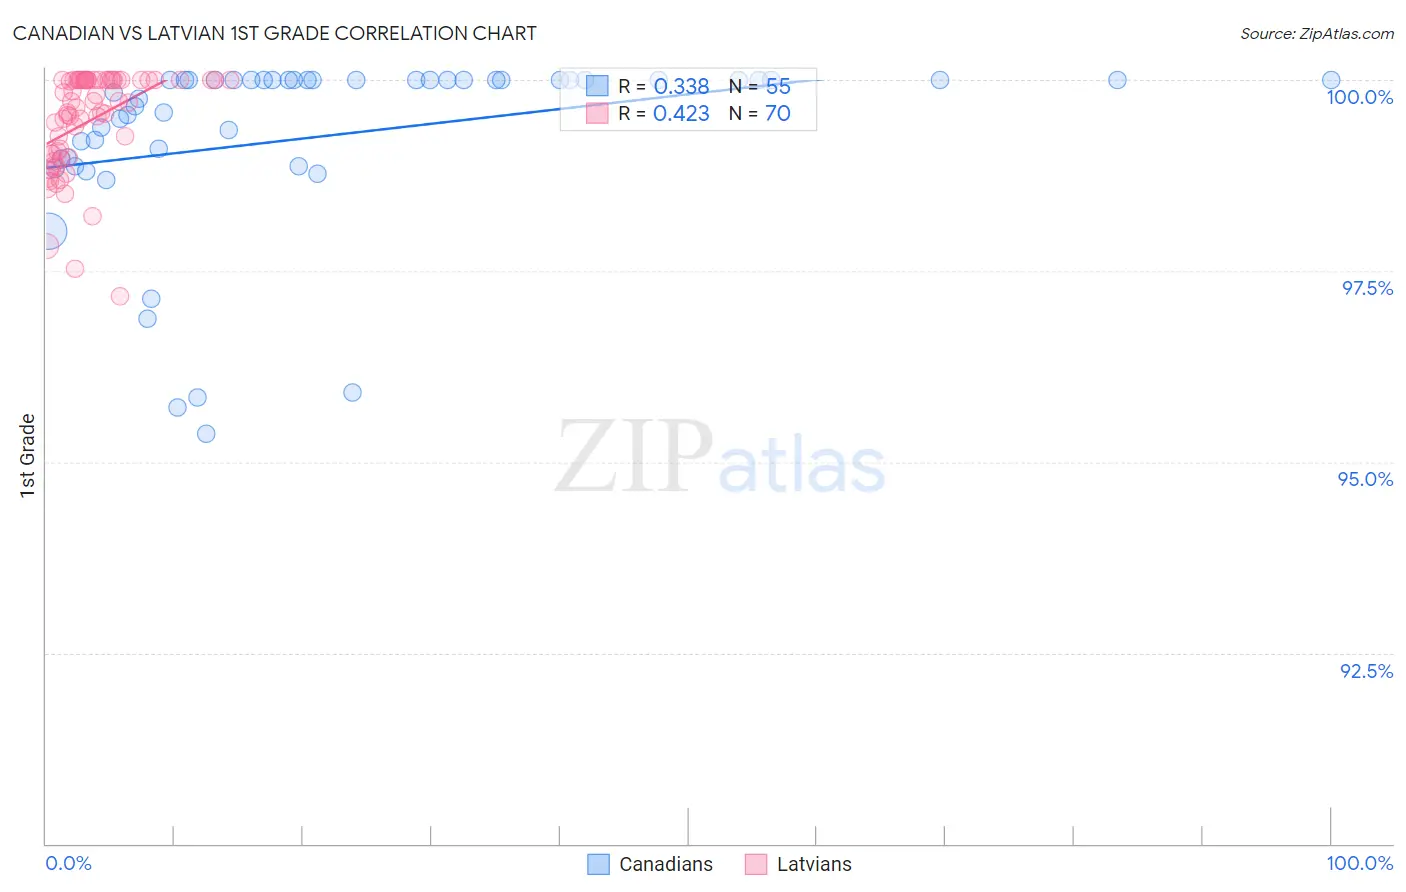
Canadian vs Latvian 1st Grade Correlation Chart
The statistical analysis conducted on geographies consisting of 437,557,033 people shows a mild positive correlation between the proportion of Canadians and percentage of population with at least 1st grade education in the United States with a correlation coefficient (R) of 0.338 and weighted average of 98.3%. Similarly, the statistical analysis conducted on geographies consisting of 220,726,452 people shows a moderate positive correlation between the proportion of Latvians and percentage of population with at least 1st grade education in the United States with a correlation coefficient (R) of 0.423 and weighted average of 98.5%, a difference of 0.13%.
1st Grade Correlation Summary
| Measurement | Canadian | Latvian |
| Minimum | 95.4% | 97.2% |
| Maximum | 100.0% | 100.0% |
| Range | 4.6% | 2.8% |
| Mean | 99.3% | 99.5% |
| Median | 100.0% | 99.7% |
| Interquartile 25% (IQ1) | 99.0% | 99.0% |
| Interquartile 75% (IQ3) | 100.0% | 100.0% |
| Interquartile Range (IQR) | 1.0% | 0.97% |
| Standard Deviation (Sample) | 1.2% | 0.65% |
| Standard Deviation (Population) | 1.2% | 0.65% |
Similar Demographics by 1st Grade
Demographics Similar to Canadians by 1st Grade
In terms of 1st grade, the demographic groups most similar to Canadians are Immigrants from Austria (98.3%, a difference of 0.0%), Immigrants from Northern Europe (98.3%, a difference of 0.0%), Maltese (98.4%, a difference of 0.010%), Chickasaw (98.3%, a difference of 0.010%), and Russian (98.3%, a difference of 0.010%).
| Demographics | Rating | Rank | 1st Grade |
| Creek | 99.7 /100 | #59 | Exceptional 98.4% |
| Immigrants | Canada | 99.7 /100 | #60 | Exceptional 98.4% |
| Bulgarians | 99.7 /100 | #61 | Exceptional 98.4% |
| Slavs | 99.7 /100 | #62 | Exceptional 98.4% |
| Immigrants | North America | 99.7 /100 | #63 | Exceptional 98.4% |
| Greeks | 99.7 /100 | #64 | Exceptional 98.4% |
| Maltese | 99.7 /100 | #65 | Exceptional 98.4% |
| Canadians | 99.6 /100 | #66 | Exceptional 98.3% |
| Immigrants | Austria | 99.6 /100 | #67 | Exceptional 98.3% |
| Immigrants | Northern Europe | 99.6 /100 | #68 | Exceptional 98.3% |
| Chickasaw | 99.6 /100 | #69 | Exceptional 98.3% |
| Russians | 99.6 /100 | #70 | Exceptional 98.3% |
| Serbians | 99.6 /100 | #71 | Exceptional 98.3% |
| Cheyenne | 99.6 /100 | #72 | Exceptional 98.3% |
| Cajuns | 99.5 /100 | #73 | Exceptional 98.3% |
Demographics Similar to Latvians by 1st Grade
In terms of 1st grade, the demographic groups most similar to Latvians are Chippewa (98.5%, a difference of 0.0%), Italian (98.5%, a difference of 0.010%), Luxembourger (98.5%, a difference of 0.010%), Eastern European (98.5%, a difference of 0.010%), and Native Hawaiian (98.5%, a difference of 0.020%).
| Demographics | Rating | Rank | 1st Grade |
| French Canadians | 100.0 /100 | #32 | Exceptional 98.5% |
| Scandinavians | 100.0 /100 | #33 | Exceptional 98.5% |
| Swiss | 100.0 /100 | #34 | Exceptional 98.5% |
| Chinese | 100.0 /100 | #35 | Exceptional 98.5% |
| British | 100.0 /100 | #36 | Exceptional 98.5% |
| Italians | 99.9 /100 | #37 | Exceptional 98.5% |
| Chippewa | 99.9 /100 | #38 | Exceptional 98.5% |
| Latvians | 99.9 /100 | #39 | Exceptional 98.5% |
| Luxembourgers | 99.9 /100 | #40 | Exceptional 98.5% |
| Eastern Europeans | 99.9 /100 | #41 | Exceptional 98.5% |
| Native Hawaiians | 99.9 /100 | #42 | Exceptional 98.5% |
| Lumbee | 99.9 /100 | #43 | Exceptional 98.5% |
| Northern Europeans | 99.9 /100 | #44 | Exceptional 98.5% |
| Belgians | 99.9 /100 | #45 | Exceptional 98.4% |
| Hungarians | 99.9 /100 | #46 | Exceptional 98.4% |