Immigrants from Lithuania vs Latvian 1st Grade
COMPARE
Immigrants from Lithuania
Latvian
1st Grade
1st Grade Comparison
Immigrants from Lithuania
Latvians
98.3%
1ST GRADE
99.2/ 100
METRIC RATING
79th/ 347
METRIC RANK
98.5%
1ST GRADE
99.9/ 100
METRIC RATING
39th/ 347
METRIC RANK
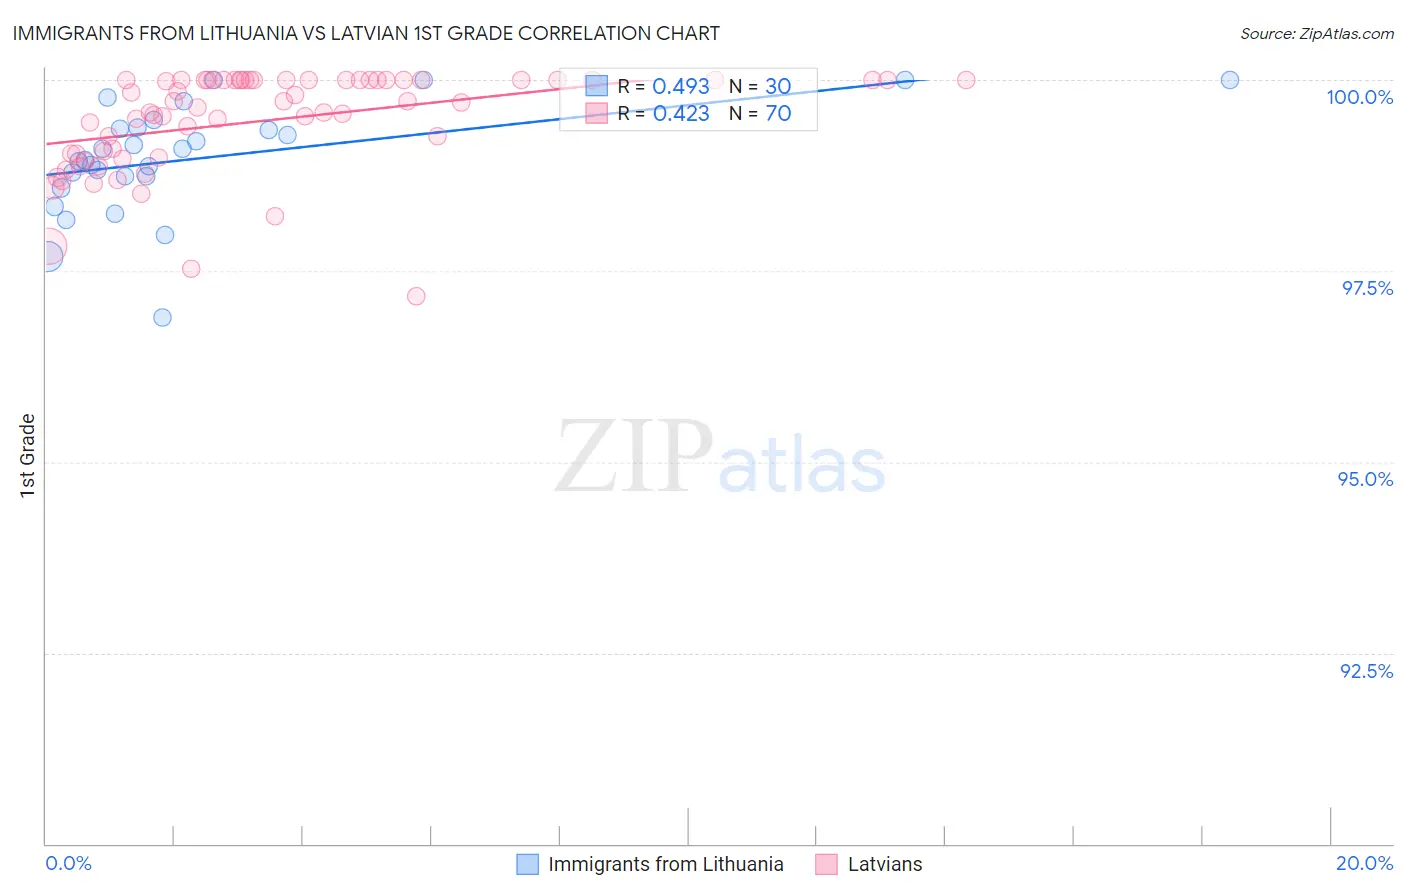
Immigrants from Lithuania vs Latvian 1st Grade Correlation Chart
The statistical analysis conducted on geographies consisting of 117,724,932 people shows a moderate positive correlation between the proportion of Immigrants from Lithuania and percentage of population with at least 1st grade education in the United States with a correlation coefficient (R) of 0.493 and weighted average of 98.3%. Similarly, the statistical analysis conducted on geographies consisting of 220,726,452 people shows a moderate positive correlation between the proportion of Latvians and percentage of population with at least 1st grade education in the United States with a correlation coefficient (R) of 0.423 and weighted average of 98.5%, a difference of 0.19%.
1st Grade Correlation Summary
| Measurement | Immigrants from Lithuania | Latvian |
| Minimum | 96.9% | 97.2% |
| Maximum | 100.0% | 100.0% |
| Range | 3.1% | 2.8% |
| Mean | 99.0% | 99.5% |
| Median | 99.0% | 99.7% |
| Interquartile 25% (IQ1) | 98.7% | 99.0% |
| Interquartile 75% (IQ3) | 99.4% | 100.0% |
| Interquartile Range (IQR) | 0.64% | 0.97% |
| Standard Deviation (Sample) | 0.72% | 0.65% |
| Standard Deviation (Population) | 0.71% | 0.65% |
Similar Demographics by 1st Grade
Demographics Similar to Immigrants from Lithuania by 1st Grade
In terms of 1st grade, the demographic groups most similar to Immigrants from Lithuania are Osage (98.3%, a difference of 0.0%), Potawatomi (98.3%, a difference of 0.0%), Icelander (98.3%, a difference of 0.0%), Shoshone (98.3%, a difference of 0.010%), and Immigrants from England (98.3%, a difference of 0.010%).
| Demographics | Rating | Rank | 1st Grade |
| Cheyenne | 99.6 /100 | #72 | Exceptional 98.3% |
| Cajuns | 99.5 /100 | #73 | Exceptional 98.3% |
| Immigrants | Netherlands | 99.4 /100 | #74 | Exceptional 98.3% |
| Cherokee | 99.3 /100 | #75 | Exceptional 98.3% |
| Shoshone | 99.3 /100 | #76 | Exceptional 98.3% |
| Immigrants | England | 99.3 /100 | #77 | Exceptional 98.3% |
| Immigrants | Belgium | 99.2 /100 | #78 | Exceptional 98.3% |
| Immigrants | Lithuania | 99.2 /100 | #79 | Exceptional 98.3% |
| Osage | 99.2 /100 | #80 | Exceptional 98.3% |
| Potawatomi | 99.1 /100 | #81 | Exceptional 98.3% |
| Icelanders | 99.1 /100 | #82 | Exceptional 98.3% |
| Immigrants | Sweden | 99.1 /100 | #83 | Exceptional 98.3% |
| Delaware | 99.1 /100 | #84 | Exceptional 98.3% |
| Hopi | 99.0 /100 | #85 | Exceptional 98.3% |
| Immigrants | Denmark | 99.0 /100 | #86 | Exceptional 98.3% |
Demographics Similar to Latvians by 1st Grade
In terms of 1st grade, the demographic groups most similar to Latvians are Chippewa (98.5%, a difference of 0.0%), Italian (98.5%, a difference of 0.010%), Luxembourger (98.5%, a difference of 0.010%), Eastern European (98.5%, a difference of 0.010%), and Native Hawaiian (98.5%, a difference of 0.020%).
| Demographics | Rating | Rank | 1st Grade |
| French Canadians | 100.0 /100 | #32 | Exceptional 98.5% |
| Scandinavians | 100.0 /100 | #33 | Exceptional 98.5% |
| Swiss | 100.0 /100 | #34 | Exceptional 98.5% |
| Chinese | 100.0 /100 | #35 | Exceptional 98.5% |
| British | 100.0 /100 | #36 | Exceptional 98.5% |
| Italians | 99.9 /100 | #37 | Exceptional 98.5% |
| Chippewa | 99.9 /100 | #38 | Exceptional 98.5% |
| Latvians | 99.9 /100 | #39 | Exceptional 98.5% |
| Luxembourgers | 99.9 /100 | #40 | Exceptional 98.5% |
| Eastern Europeans | 99.9 /100 | #41 | Exceptional 98.5% |
| Native Hawaiians | 99.9 /100 | #42 | Exceptional 98.5% |
| Lumbee | 99.9 /100 | #43 | Exceptional 98.5% |
| Northern Europeans | 99.9 /100 | #44 | Exceptional 98.5% |
| Belgians | 99.9 /100 | #45 | Exceptional 98.4% |
| Hungarians | 99.9 /100 | #46 | Exceptional 98.4% |