Jordanian vs Immigrants from Nepal 6th Grade
COMPARE
Jordanian
Immigrants from Nepal
6th Grade
6th Grade Comparison
Jordanians
Immigrants from Nepal
97.2%
6TH GRADE
84.6/ 100
METRIC RATING
142nd/ 347
METRIC RANK
96.8%
6TH GRADE
10.1/ 100
METRIC RATING
210th/ 347
METRIC RANK
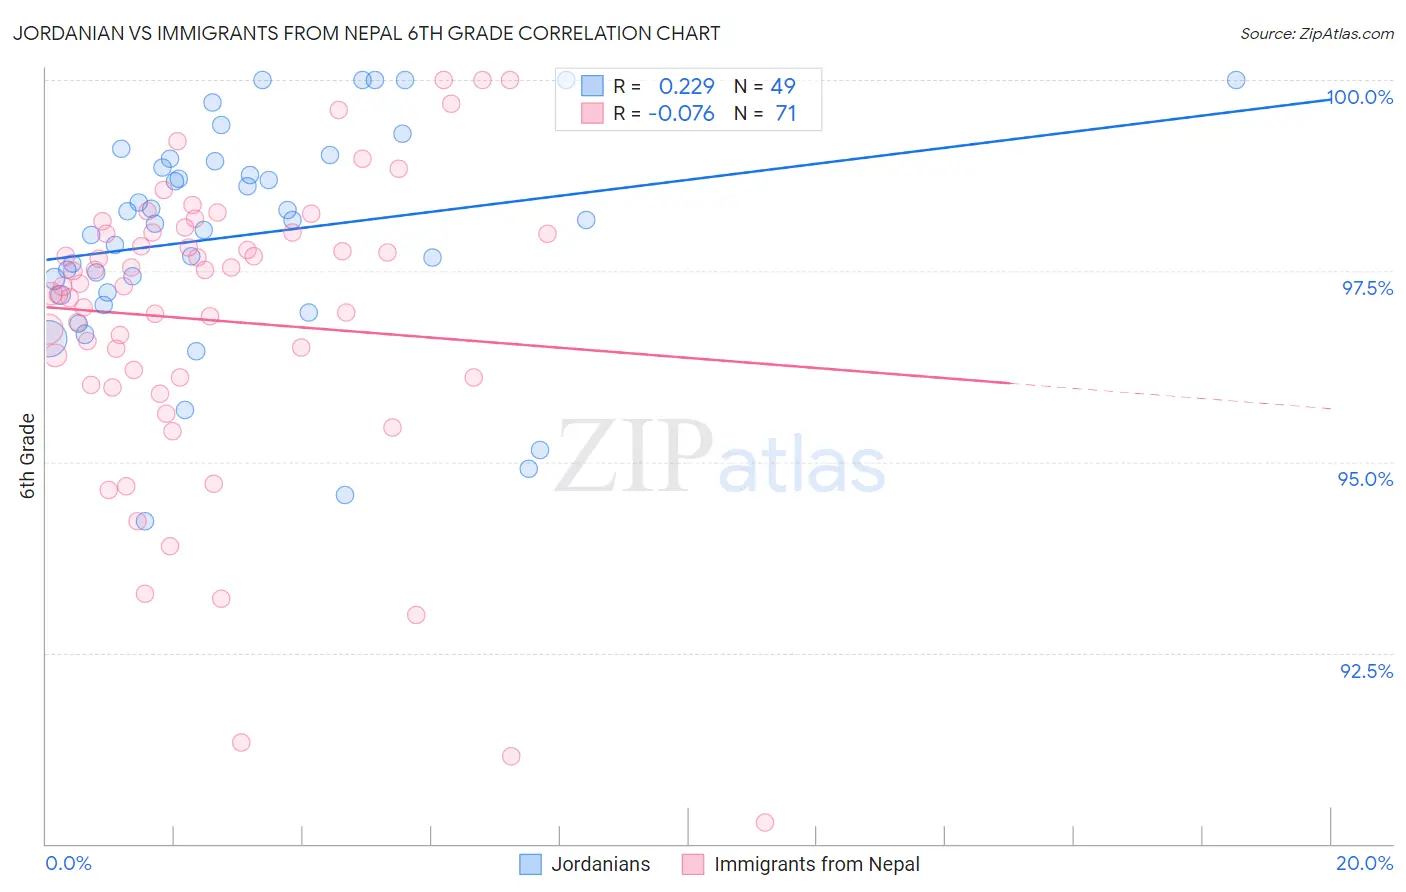
Jordanian vs Immigrants from Nepal 6th Grade Correlation Chart
The statistical analysis conducted on geographies consisting of 166,424,117 people shows a weak positive correlation between the proportion of Jordanians and percentage of population with at least 6th grade education in the United States with a correlation coefficient (R) of 0.229 and weighted average of 97.2%. Similarly, the statistical analysis conducted on geographies consisting of 186,739,570 people shows a slight negative correlation between the proportion of Immigrants from Nepal and percentage of population with at least 6th grade education in the United States with a correlation coefficient (R) of -0.076 and weighted average of 96.8%, a difference of 0.44%.
6th Grade Correlation Summary
| Measurement | Jordanian | Immigrants from Nepal |
| Minimum | 94.2% | 90.3% |
| Maximum | 100.0% | 100.0% |
| Range | 5.8% | 9.7% |
| Mean | 98.0% | 96.8% |
| Median | 98.2% | 97.3% |
| Interquartile 25% (IQ1) | 97.2% | 96.1% |
| Interquartile 75% (IQ3) | 99.0% | 98.0% |
| Interquartile Range (IQR) | 1.7% | 1.9% |
| Standard Deviation (Sample) | 1.4% | 2.0% |
| Standard Deviation (Population) | 1.4% | 2.0% |
Similar Demographics by 6th Grade
Demographics Similar to Jordanians by 6th Grade
In terms of 6th grade, the demographic groups most similar to Jordanians are Seminole (97.2%, a difference of 0.0%), Immigrants from Turkey (97.3%, a difference of 0.010%), Immigrants from North Macedonia (97.2%, a difference of 0.010%), Pima (97.2%, a difference of 0.010%), and Israeli (97.2%, a difference of 0.010%).
| Demographics | Rating | Rank | 6th Grade |
| Immigrants | Hungary | 89.5 /100 | #135 | Excellent 97.3% |
| Filipinos | 88.9 /100 | #136 | Excellent 97.3% |
| Burmese | 87.8 /100 | #137 | Excellent 97.3% |
| Blackfeet | 87.7 /100 | #138 | Excellent 97.3% |
| Immigrants | Turkey | 86.1 /100 | #139 | Excellent 97.3% |
| Immigrants | North Macedonia | 85.5 /100 | #140 | Excellent 97.2% |
| Seminole | 84.8 /100 | #141 | Excellent 97.2% |
| Jordanians | 84.6 /100 | #142 | Excellent 97.2% |
| Pima | 82.9 /100 | #143 | Excellent 97.2% |
| Israelis | 82.9 /100 | #144 | Excellent 97.2% |
| Spaniards | 80.1 /100 | #145 | Excellent 97.2% |
| Hopi | 78.8 /100 | #146 | Good 97.2% |
| Immigrants | South Central Asia | 78.1 /100 | #147 | Good 97.2% |
| Immigrants | Greece | 77.8 /100 | #148 | Good 97.2% |
| Immigrants | Israel | 76.0 /100 | #149 | Good 97.2% |
Demographics Similar to Immigrants from Nepal by 6th Grade
In terms of 6th grade, the demographic groups most similar to Immigrants from Nepal are Samoan (96.8%, a difference of 0.010%), Immigrants from Oceania (96.8%, a difference of 0.010%), Immigrants from Iraq (96.8%, a difference of 0.010%), Laotian (96.8%, a difference of 0.020%), and Iraqi (96.8%, a difference of 0.020%).
| Demographics | Rating | Rank | 6th Grade |
| Sudanese | 13.9 /100 | #203 | Poor 96.8% |
| Immigrants | Bahamas | 13.8 /100 | #204 | Poor 96.8% |
| Natives/Alaskans | 13.0 /100 | #205 | Poor 96.8% |
| Laotians | 11.8 /100 | #206 | Poor 96.8% |
| Iraqis | 11.7 /100 | #207 | Poor 96.8% |
| Samoans | 11.0 /100 | #208 | Poor 96.8% |
| Immigrants | Oceania | 11.0 /100 | #209 | Poor 96.8% |
| Immigrants | Nepal | 10.1 /100 | #210 | Poor 96.8% |
| Immigrants | Iraq | 9.2 /100 | #211 | Tragic 96.8% |
| Moroccans | 9.0 /100 | #212 | Tragic 96.8% |
| Immigrants | Sudan | 8.7 /100 | #213 | Tragic 96.8% |
| Portuguese | 8.2 /100 | #214 | Tragic 96.8% |
| Sierra Leoneans | 8.0 /100 | #215 | Tragic 96.8% |
| Paiute | 7.8 /100 | #216 | Tragic 96.8% |
| Liberians | 7.5 /100 | #217 | Tragic 96.8% |