Immigrants from South Africa vs Immigrants from Brazil 11th Grade
COMPARE
Immigrants from South Africa
Immigrants from Brazil
11th Grade
11th Grade Comparison
Immigrants from South Africa
Immigrants from Brazil
93.8%
11TH GRADE
99.7/ 100
METRIC RATING
71st/ 347
METRIC RANK
92.9%
11TH GRADE
85.1/ 100
METRIC RATING
138th/ 347
METRIC RANK
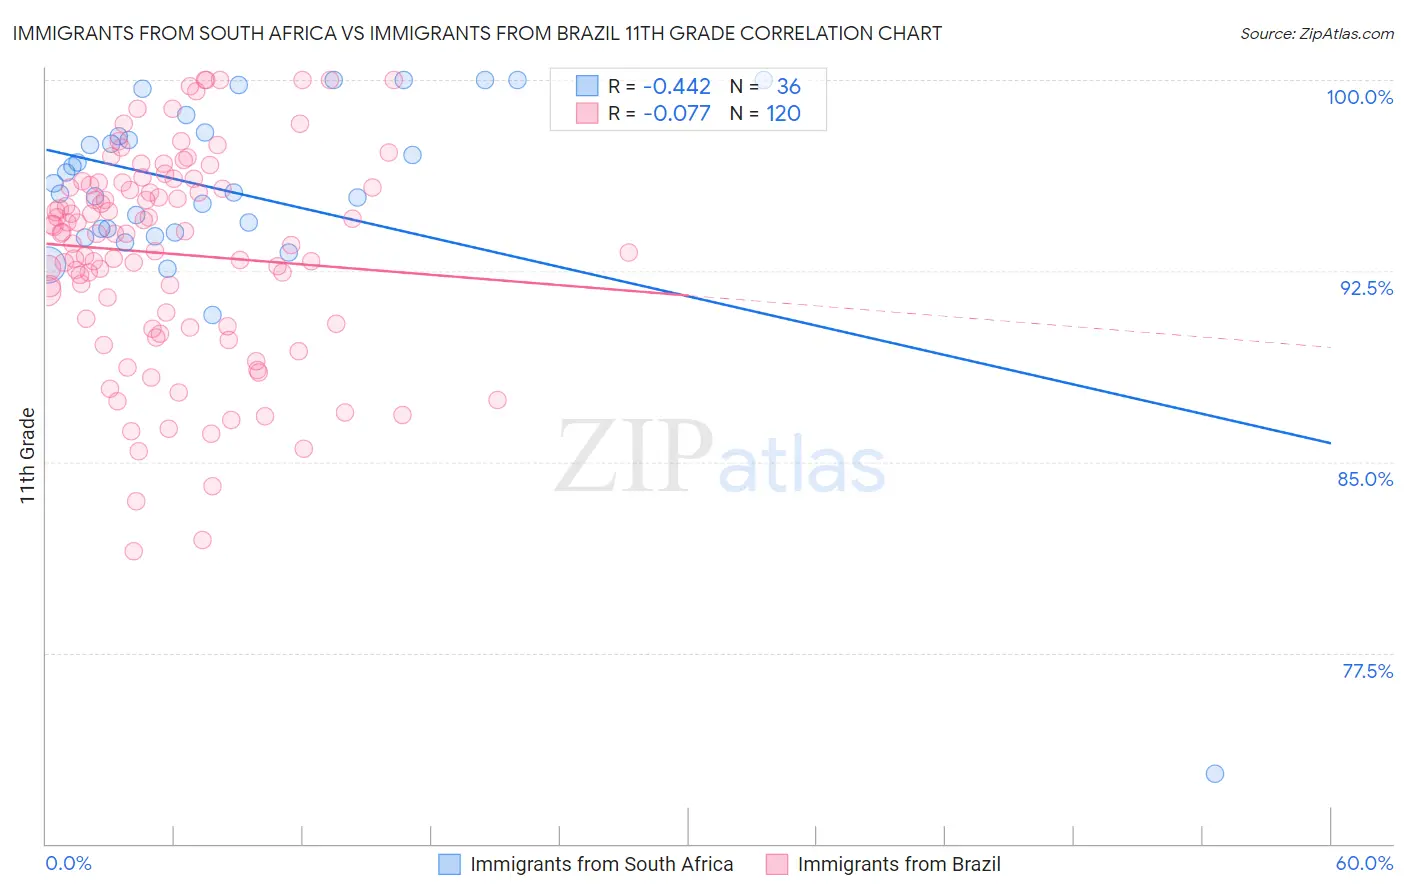
Immigrants from South Africa vs Immigrants from Brazil 11th Grade Correlation Chart
The statistical analysis conducted on geographies consisting of 233,321,693 people shows a moderate negative correlation between the proportion of Immigrants from South Africa and percentage of population with at least 11th grade education in the United States with a correlation coefficient (R) of -0.442 and weighted average of 93.8%. Similarly, the statistical analysis conducted on geographies consisting of 342,965,001 people shows a slight negative correlation between the proportion of Immigrants from Brazil and percentage of population with at least 11th grade education in the United States with a correlation coefficient (R) of -0.077 and weighted average of 92.9%, a difference of 0.99%.
11th Grade Correlation Summary
| Measurement | Immigrants from South Africa | Immigrants from Brazil |
| Minimum | 72.7% | 81.5% |
| Maximum | 100.0% | 100.0% |
| Range | 27.3% | 18.5% |
| Mean | 95.6% | 93.2% |
| Median | 95.8% | 94.0% |
| Interquartile 25% (IQ1) | 94.1% | 90.4% |
| Interquartile 75% (IQ3) | 97.8% | 95.9% |
| Interquartile Range (IQR) | 3.8% | 5.5% |
| Standard Deviation (Sample) | 4.6% | 4.1% |
| Standard Deviation (Population) | 4.6% | 4.1% |
Similar Demographics by 11th Grade
Demographics Similar to Immigrants from South Africa by 11th Grade
In terms of 11th grade, the demographic groups most similar to Immigrants from South Africa are Immigrants from England (93.8%, a difference of 0.010%), Immigrants from Japan (93.8%, a difference of 0.030%), Romanian (93.8%, a difference of 0.050%), Immigrants from Czechoslovakia (93.8%, a difference of 0.050%), and Scotch-Irish (93.9%, a difference of 0.060%).
| Demographics | Rating | Rank | 11th Grade |
| Immigrants | Sweden | 99.8 /100 | #64 | Exceptional 93.9% |
| Native Hawaiians | 99.8 /100 | #65 | Exceptional 93.9% |
| Alaskan Athabascans | 99.8 /100 | #66 | Exceptional 93.9% |
| Immigrants | Netherlands | 99.8 /100 | #67 | Exceptional 93.9% |
| Zimbabweans | 99.8 /100 | #68 | Exceptional 93.9% |
| Scotch-Irish | 99.8 /100 | #69 | Exceptional 93.9% |
| Immigrants | England | 99.7 /100 | #70 | Exceptional 93.8% |
| Immigrants | South Africa | 99.7 /100 | #71 | Exceptional 93.8% |
| Immigrants | Japan | 99.7 /100 | #72 | Exceptional 93.8% |
| Romanians | 99.6 /100 | #73 | Exceptional 93.8% |
| Immigrants | Czechoslovakia | 99.6 /100 | #74 | Exceptional 93.8% |
| Immigrants | Latvia | 99.6 /100 | #75 | Exceptional 93.8% |
| Celtics | 99.5 /100 | #76 | Exceptional 93.7% |
| Aleuts | 99.5 /100 | #77 | Exceptional 93.7% |
| Soviet Union | 99.5 /100 | #78 | Exceptional 93.7% |
Demographics Similar to Immigrants from Brazil by 11th Grade
In terms of 11th grade, the demographic groups most similar to Immigrants from Brazil are Arab (92.9%, a difference of 0.010%), Cree (92.9%, a difference of 0.020%), Crow (92.9%, a difference of 0.020%), Immigrants from Italy (92.9%, a difference of 0.030%), and Venezuelan (92.9%, a difference of 0.030%).
| Demographics | Rating | Rank | 11th Grade |
| Egyptians | 89.5 /100 | #131 | Excellent 93.0% |
| Immigrants | Bosnia and Herzegovina | 89.0 /100 | #132 | Excellent 93.0% |
| Mongolians | 87.6 /100 | #133 | Excellent 93.0% |
| Delaware | 87.3 /100 | #134 | Excellent 93.0% |
| Immigrants | Italy | 86.6 /100 | #135 | Excellent 92.9% |
| Cree | 85.9 /100 | #136 | Excellent 92.9% |
| Arabs | 85.4 /100 | #137 | Excellent 92.9% |
| Immigrants | Brazil | 85.1 /100 | #138 | Excellent 92.9% |
| Crow | 84.1 /100 | #139 | Excellent 92.9% |
| Venezuelans | 83.4 /100 | #140 | Excellent 92.9% |
| Chileans | 83.0 /100 | #141 | Excellent 92.9% |
| Kenyans | 82.0 /100 | #142 | Excellent 92.9% |
| Ugandans | 81.4 /100 | #143 | Excellent 92.9% |
| Assyrians/Chaldeans/Syriacs | 80.5 /100 | #144 | Excellent 92.8% |
| Pakistanis | 79.6 /100 | #145 | Good 92.8% |