Immigrants from Thailand vs Colville Professional Degree
COMPARE
Immigrants from Thailand
Colville
Professional Degree
Professional Degree Comparison
Immigrants from Thailand
Colville
4.3%
PROFESSIONAL DEGREE
31.7/ 100
METRIC RATING
188th/ 347
METRIC RANK
3.8%
PROFESSIONAL DEGREE
2.6/ 100
METRIC RATING
238th/ 347
METRIC RANK
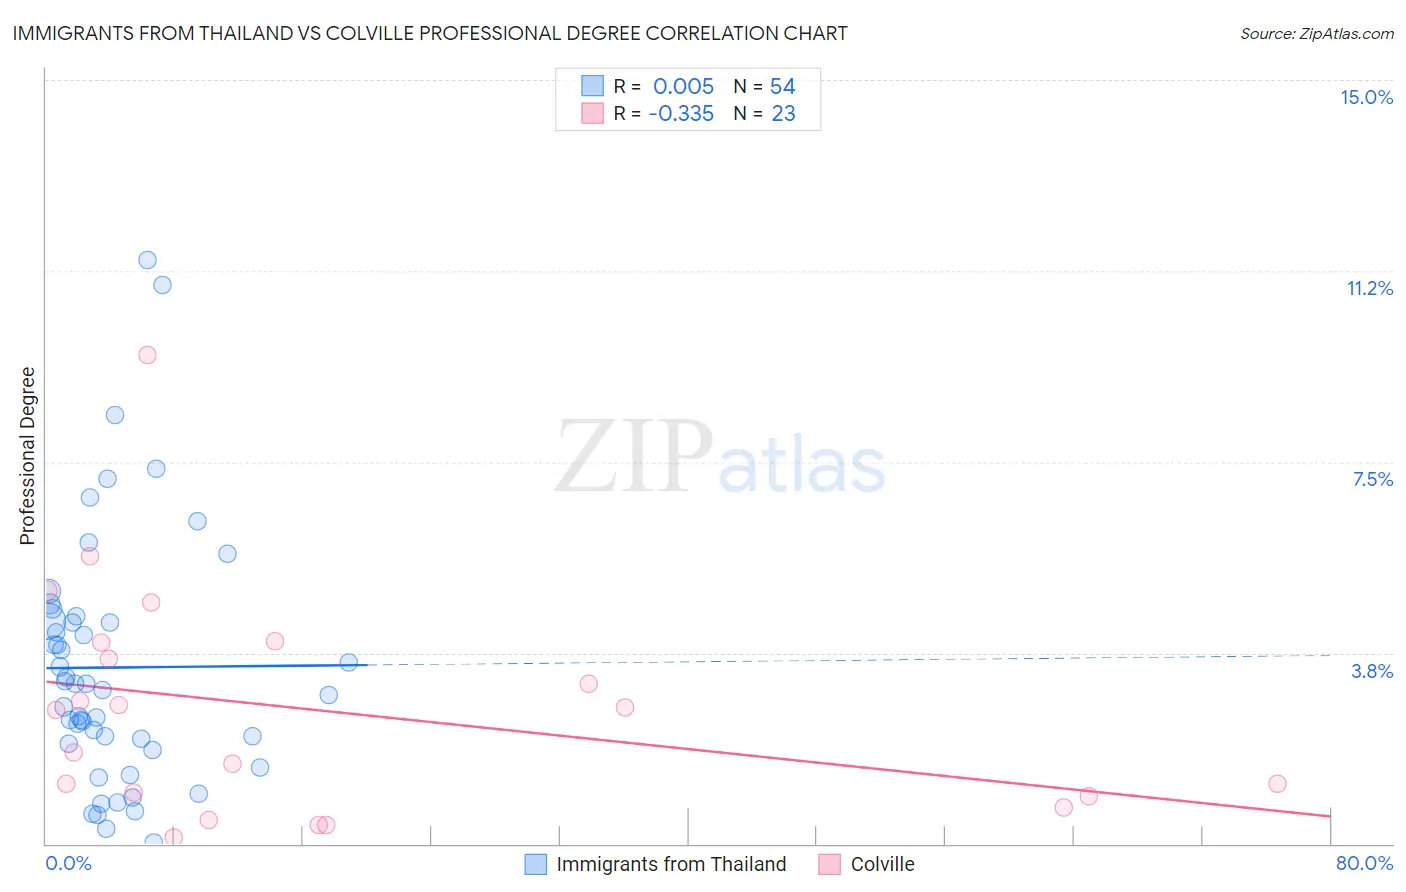
Immigrants from Thailand vs Colville Professional Degree Correlation Chart
The statistical analysis conducted on geographies consisting of 316,529,517 people shows no correlation between the proportion of Immigrants from Thailand and percentage of population with at least professional degree education in the United States with a correlation coefficient (R) of 0.005 and weighted average of 4.3%. Similarly, the statistical analysis conducted on geographies consisting of 34,643,390 people shows a mild negative correlation between the proportion of Colville and percentage of population with at least professional degree education in the United States with a correlation coefficient (R) of -0.335 and weighted average of 3.8%, a difference of 11.9%.
Professional Degree Correlation Summary
| Measurement | Immigrants from Thailand | Colville |
| Minimum | 0.034% | 0.12% |
| Maximum | 11.5% | 9.6% |
| Range | 11.4% | 9.5% |
| Mean | 3.5% | 2.6% |
| Median | 3.1% | 2.6% |
| Interquartile 25% (IQ1) | 2.0% | 0.93% |
| Interquartile 75% (IQ3) | 4.4% | 4.0% |
| Interquartile Range (IQR) | 2.4% | 3.0% |
| Standard Deviation (Sample) | 2.5% | 2.2% |
| Standard Deviation (Population) | 2.4% | 2.2% |
Similar Demographics by Professional Degree
Demographics Similar to Immigrants from Thailand by Professional Degree
In terms of professional degree, the demographic groups most similar to Immigrants from Thailand are Slovak (4.3%, a difference of 0.17%), Immigrants from Cameroon (4.3%, a difference of 0.28%), Scotch-Irish (4.3%, a difference of 0.43%), Immigrants from Poland (4.3%, a difference of 0.44%), and Sri Lankan (4.3%, a difference of 0.47%).
| Demographics | Rating | Rank | Professional Degree |
| Danes | 43.5 /100 | #181 | Average 4.4% |
| Immigrants | Immigrants | 43.2 /100 | #182 | Average 4.4% |
| Bermudans | 43.1 /100 | #183 | Average 4.4% |
| Belgians | 36.2 /100 | #184 | Fair 4.3% |
| Welsh | 35.8 /100 | #185 | Fair 4.3% |
| Scotch-Irish | 34.2 /100 | #186 | Fair 4.3% |
| Immigrants | Cameroon | 33.3 /100 | #187 | Fair 4.3% |
| Immigrants | Thailand | 31.7 /100 | #188 | Fair 4.3% |
| Slovaks | 30.7 /100 | #189 | Fair 4.3% |
| Immigrants | Poland | 29.2 /100 | #190 | Fair 4.3% |
| Sri Lankans | 29.0 /100 | #191 | Fair 4.3% |
| Ghanaians | 27.3 /100 | #192 | Fair 4.3% |
| French | 27.1 /100 | #193 | Fair 4.2% |
| Scandinavians | 25.8 /100 | #194 | Fair 4.2% |
| Nigerians | 24.6 /100 | #195 | Fair 4.2% |
Demographics Similar to Colville by Professional Degree
In terms of professional degree, the demographic groups most similar to Colville are British West Indian (3.8%, a difference of 0.39%), Immigrants from Ecuador (3.8%, a difference of 0.62%), Alaskan Athabascan (3.8%, a difference of 0.64%), Native Hawaiian (3.8%, a difference of 0.64%), and Guamanian/Chamorro (3.8%, a difference of 0.72%).
| Demographics | Rating | Rank | Professional Degree |
| Ecuadorians | 4.6 /100 | #231 | Tragic 3.9% |
| Cree | 4.3 /100 | #232 | Tragic 3.9% |
| Immigrants | Philippines | 4.1 /100 | #233 | Tragic 3.9% |
| Immigrants | Nonimmigrants | 4.0 /100 | #234 | Tragic 3.9% |
| Immigrants | Barbados | 4.0 /100 | #235 | Tragic 3.9% |
| Spanish Americans | 3.8 /100 | #236 | Tragic 3.9% |
| Immigrants | Trinidad and Tobago | 3.8 /100 | #237 | Tragic 3.9% |
| Colville | 2.6 /100 | #238 | Tragic 3.8% |
| British West Indians | 2.4 /100 | #239 | Tragic 3.8% |
| Immigrants | Ecuador | 2.3 /100 | #240 | Tragic 3.8% |
| Alaskan Athabascans | 2.3 /100 | #241 | Tragic 3.8% |
| Native Hawaiians | 2.3 /100 | #242 | Tragic 3.8% |
| Guamanians/Chamorros | 2.2 /100 | #243 | Tragic 3.8% |
| Immigrants | Bahamas | 2.0 /100 | #244 | Tragic 3.8% |
| French American Indians | 1.7 /100 | #245 | Tragic 3.8% |