Northern European vs Immigrants from Iran 1st Grade
COMPARE
Northern European
Immigrants from Iran
1st Grade
1st Grade Comparison
Northern Europeans
Immigrants from Iran
98.5%
1ST GRADE
99.9/ 100
METRIC RATING
44th/ 347
METRIC RANK
98.0%
1ST GRADE
66.9/ 100
METRIC RATING
154th/ 347
METRIC RANK
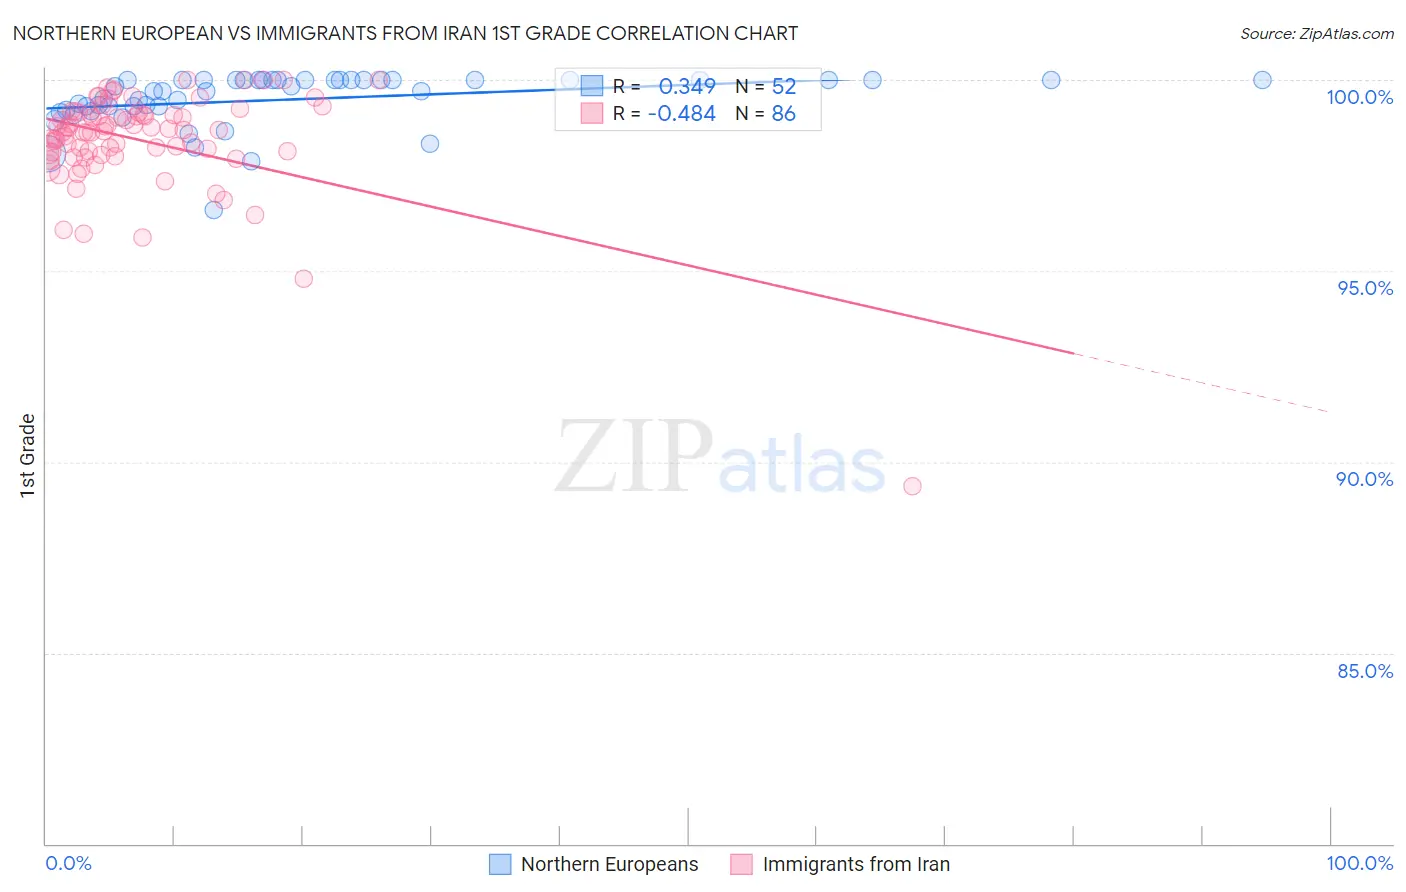
Northern European vs Immigrants from Iran 1st Grade Correlation Chart
The statistical analysis conducted on geographies consisting of 406,093,361 people shows a mild positive correlation between the proportion of Northern Europeans and percentage of population with at least 1st grade education in the United States with a correlation coefficient (R) of 0.349 and weighted average of 98.5%. Similarly, the statistical analysis conducted on geographies consisting of 279,886,762 people shows a moderate negative correlation between the proportion of Immigrants from Iran and percentage of population with at least 1st grade education in the United States with a correlation coefficient (R) of -0.484 and weighted average of 98.0%, a difference of 0.49%.
1st Grade Correlation Summary
| Measurement | Northern European | Immigrants from Iran |
| Minimum | 96.6% | 89.4% |
| Maximum | 100.0% | 100.0% |
| Range | 3.4% | 10.6% |
| Mean | 99.5% | 98.4% |
| Median | 99.7% | 98.7% |
| Interquartile 25% (IQ1) | 99.3% | 98.1% |
| Interquartile 75% (IQ3) | 100.0% | 99.1% |
| Interquartile Range (IQR) | 0.74% | 1.0% |
| Standard Deviation (Sample) | 0.70% | 1.4% |
| Standard Deviation (Population) | 0.69% | 1.4% |
Similar Demographics by 1st Grade
Demographics Similar to Northern Europeans by 1st Grade
In terms of 1st grade, the demographic groups most similar to Northern Europeans are Lumbee (98.5%, a difference of 0.0%), Belgian (98.4%, a difference of 0.0%), Luxembourger (98.5%, a difference of 0.010%), Eastern European (98.5%, a difference of 0.010%), and Native Hawaiian (98.5%, a difference of 0.010%).
| Demographics | Rating | Rank | 1st Grade |
| Italians | 99.9 /100 | #37 | Exceptional 98.5% |
| Chippewa | 99.9 /100 | #38 | Exceptional 98.5% |
| Latvians | 99.9 /100 | #39 | Exceptional 98.5% |
| Luxembourgers | 99.9 /100 | #40 | Exceptional 98.5% |
| Eastern Europeans | 99.9 /100 | #41 | Exceptional 98.5% |
| Native Hawaiians | 99.9 /100 | #42 | Exceptional 98.5% |
| Lumbee | 99.9 /100 | #43 | Exceptional 98.5% |
| Northern Europeans | 99.9 /100 | #44 | Exceptional 98.5% |
| Belgians | 99.9 /100 | #45 | Exceptional 98.4% |
| Hungarians | 99.9 /100 | #46 | Exceptional 98.4% |
| Ottawa | 99.8 /100 | #47 | Exceptional 98.4% |
| Czechoslovakians | 99.8 /100 | #48 | Exceptional 98.4% |
| Celtics | 99.8 /100 | #49 | Exceptional 98.4% |
| Whites/Caucasians | 99.8 /100 | #50 | Exceptional 98.4% |
| Estonians | 99.8 /100 | #51 | Exceptional 98.4% |
Demographics Similar to Immigrants from Iran by 1st Grade
In terms of 1st grade, the demographic groups most similar to Immigrants from Iran are Comanche (98.0%, a difference of 0.0%), Immigrants from South Central Asia (98.0%, a difference of 0.0%), Dutch West Indian (98.0%, a difference of 0.010%), Immigrants from Moldova (98.0%, a difference of 0.010%), and Soviet Union (98.0%, a difference of 0.010%).
| Demographics | Rating | Rank | 1st Grade |
| Filipinos | 77.6 /100 | #147 | Good 98.0% |
| Apache | 75.2 /100 | #148 | Good 98.0% |
| Immigrants | Greece | 74.9 /100 | #149 | Good 98.0% |
| Jordanians | 72.7 /100 | #150 | Good 98.0% |
| Dutch West Indians | 69.8 /100 | #151 | Good 98.0% |
| Immigrants | Moldova | 69.5 /100 | #152 | Good 98.0% |
| Soviet Union | 68.9 /100 | #153 | Good 98.0% |
| Immigrants | Iran | 66.9 /100 | #154 | Good 98.0% |
| Comanche | 66.9 /100 | #155 | Good 98.0% |
| Immigrants | South Central Asia | 66.2 /100 | #156 | Good 98.0% |
| Immigrants | North Macedonia | 65.3 /100 | #157 | Good 98.0% |
| Venezuelans | 64.7 /100 | #158 | Good 98.0% |
| French American Indians | 63.7 /100 | #159 | Good 98.0% |
| Immigrants | Russia | 59.2 /100 | #160 | Average 97.9% |
| Immigrants | Italy | 59.1 /100 | #161 | Average 97.9% |