Immigrants from Ecuador vs Immigrants from Iran 1st Grade
COMPARE
Immigrants from Ecuador
Immigrants from Iran
1st Grade
1st Grade Comparison
Immigrants from Ecuador
Immigrants from Iran
96.9%
1ST GRADE
0.0/ 100
METRIC RATING
316th/ 347
METRIC RANK
98.0%
1ST GRADE
66.9/ 100
METRIC RATING
154th/ 347
METRIC RANK
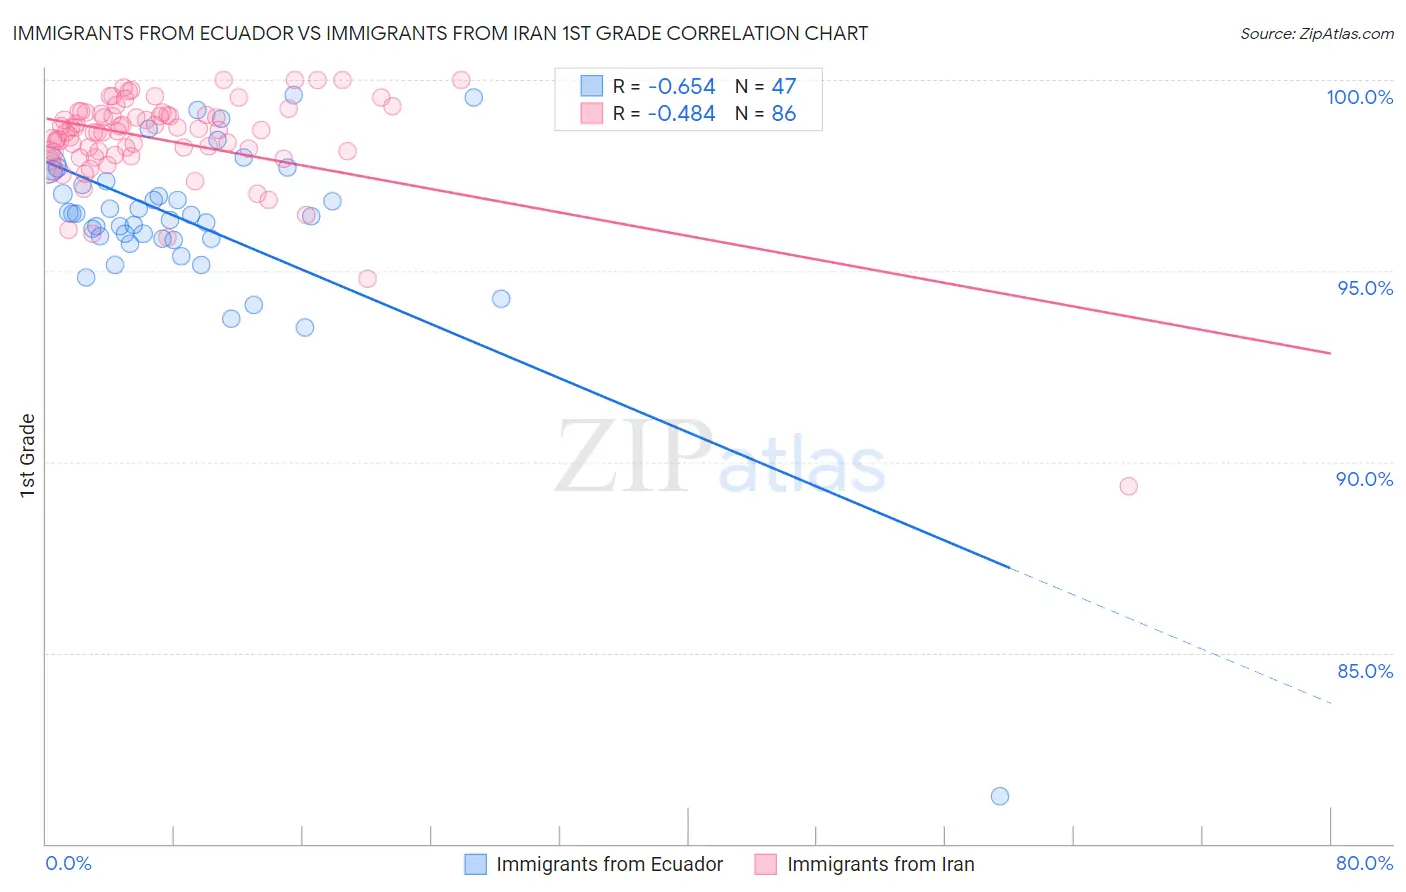
Immigrants from Ecuador vs Immigrants from Iran 1st Grade Correlation Chart
The statistical analysis conducted on geographies consisting of 271,020,679 people shows a significant negative correlation between the proportion of Immigrants from Ecuador and percentage of population with at least 1st grade education in the United States with a correlation coefficient (R) of -0.654 and weighted average of 96.9%. Similarly, the statistical analysis conducted on geographies consisting of 279,886,762 people shows a moderate negative correlation between the proportion of Immigrants from Iran and percentage of population with at least 1st grade education in the United States with a correlation coefficient (R) of -0.484 and weighted average of 98.0%, a difference of 1.1%.
1st Grade Correlation Summary
| Measurement | Immigrants from Ecuador | Immigrants from Iran |
| Minimum | 81.2% | 89.4% |
| Maximum | 99.6% | 100.0% |
| Range | 18.3% | 10.6% |
| Mean | 96.3% | 98.4% |
| Median | 96.5% | 98.7% |
| Interquartile 25% (IQ1) | 95.8% | 98.1% |
| Interquartile 75% (IQ3) | 97.3% | 99.1% |
| Interquartile Range (IQR) | 1.5% | 1.0% |
| Standard Deviation (Sample) | 2.6% | 1.4% |
| Standard Deviation (Population) | 2.6% | 1.4% |
Similar Demographics by 1st Grade
Demographics Similar to Immigrants from Ecuador by 1st Grade
In terms of 1st grade, the demographic groups most similar to Immigrants from Ecuador are Immigrants from Nicaragua (96.9%, a difference of 0.0%), Immigrants from Belize (96.9%, a difference of 0.010%), Honduran (96.9%, a difference of 0.020%), Cape Verdean (96.9%, a difference of 0.040%), and Guyanese (96.9%, a difference of 0.040%).
| Demographics | Rating | Rank | 1st Grade |
| Immigrants | Haiti | 0.0 /100 | #309 | Tragic 96.9% |
| Immigrants | Azores | 0.0 /100 | #310 | Tragic 96.9% |
| Sri Lankans | 0.0 /100 | #311 | Tragic 96.9% |
| Cape Verdeans | 0.0 /100 | #312 | Tragic 96.9% |
| Guyanese | 0.0 /100 | #313 | Tragic 96.9% |
| Hondurans | 0.0 /100 | #314 | Tragic 96.9% |
| Immigrants | Belize | 0.0 /100 | #315 | Tragic 96.9% |
| Immigrants | Ecuador | 0.0 /100 | #316 | Tragic 96.9% |
| Immigrants | Nicaragua | 0.0 /100 | #317 | Tragic 96.9% |
| Immigrants | Laos | 0.0 /100 | #318 | Tragic 96.8% |
| Immigrants | Guyana | 0.0 /100 | #319 | Tragic 96.8% |
| Immigrants | Burma/Myanmar | 0.0 /100 | #320 | Tragic 96.8% |
| Immigrants | Bangladesh | 0.0 /100 | #321 | Tragic 96.8% |
| Mexican American Indians | 0.0 /100 | #322 | Tragic 96.8% |
| Immigrants | Honduras | 0.0 /100 | #323 | Tragic 96.8% |
Demographics Similar to Immigrants from Iran by 1st Grade
In terms of 1st grade, the demographic groups most similar to Immigrants from Iran are Comanche (98.0%, a difference of 0.0%), Immigrants from South Central Asia (98.0%, a difference of 0.0%), Dutch West Indian (98.0%, a difference of 0.010%), Immigrants from Moldova (98.0%, a difference of 0.010%), and Soviet Union (98.0%, a difference of 0.010%).
| Demographics | Rating | Rank | 1st Grade |
| Filipinos | 77.6 /100 | #147 | Good 98.0% |
| Apache | 75.2 /100 | #148 | Good 98.0% |
| Immigrants | Greece | 74.9 /100 | #149 | Good 98.0% |
| Jordanians | 72.7 /100 | #150 | Good 98.0% |
| Dutch West Indians | 69.8 /100 | #151 | Good 98.0% |
| Immigrants | Moldova | 69.5 /100 | #152 | Good 98.0% |
| Soviet Union | 68.9 /100 | #153 | Good 98.0% |
| Immigrants | Iran | 66.9 /100 | #154 | Good 98.0% |
| Comanche | 66.9 /100 | #155 | Good 98.0% |
| Immigrants | South Central Asia | 66.2 /100 | #156 | Good 98.0% |
| Immigrants | North Macedonia | 65.3 /100 | #157 | Good 98.0% |
| Venezuelans | 64.7 /100 | #158 | Good 98.0% |
| French American Indians | 63.7 /100 | #159 | Good 98.0% |
| Immigrants | Russia | 59.2 /100 | #160 | Average 97.9% |
| Immigrants | Italy | 59.1 /100 | #161 | Average 97.9% |