Immigrants from Saudi Arabia vs Immigrants from Croatia 9th Grade
COMPARE
Immigrants from Saudi Arabia
Immigrants from Croatia
9th Grade
9th Grade Comparison
Immigrants from Saudi Arabia
Immigrants from Croatia
95.6%
9TH GRADE
98.8/ 100
METRIC RATING
92nd/ 347
METRIC RANK
95.4%
9TH GRADE
96.2/ 100
METRIC RATING
112th/ 347
METRIC RANK
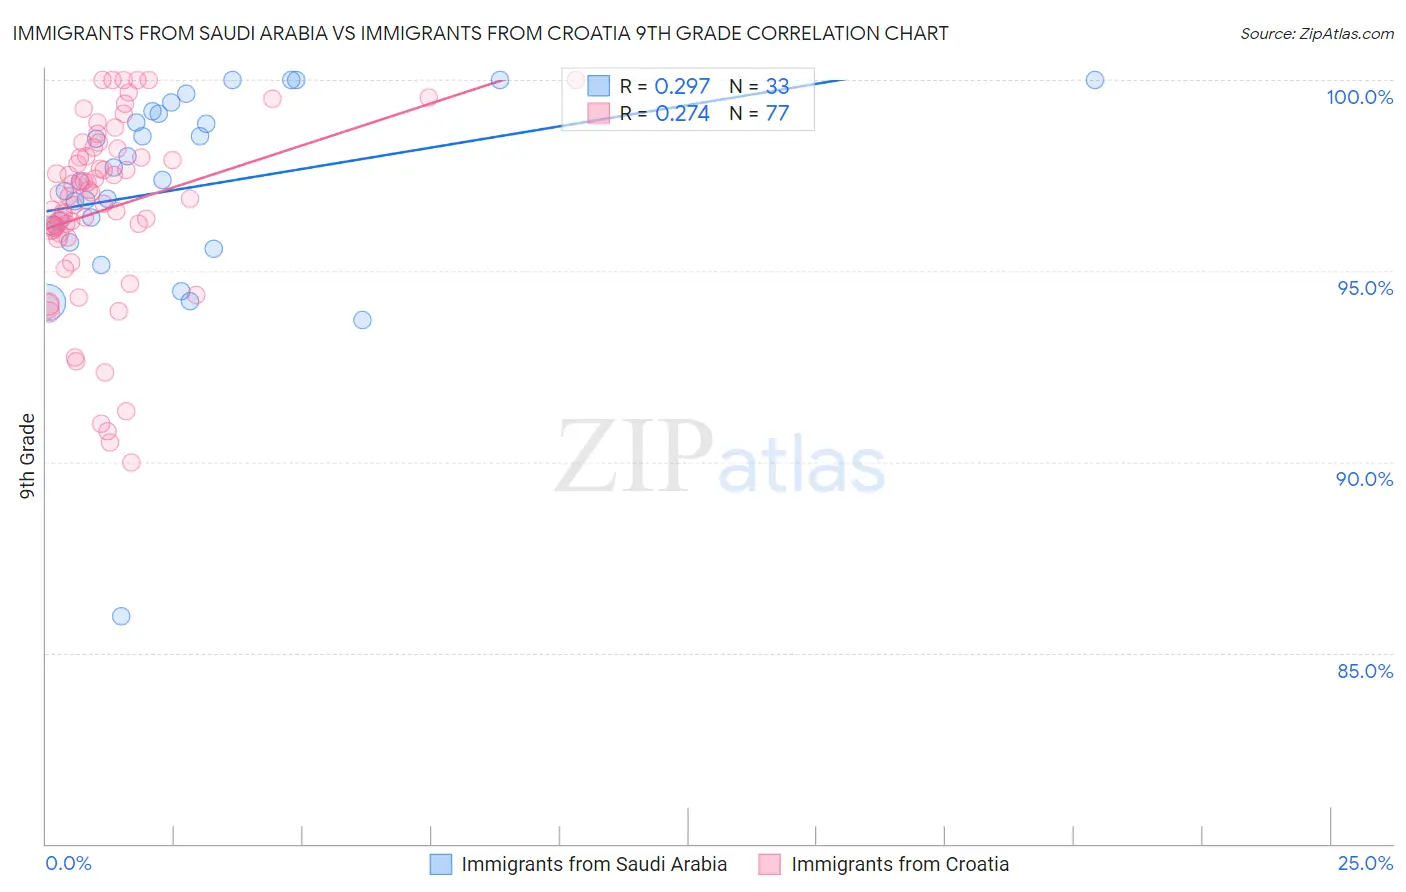
Immigrants from Saudi Arabia vs Immigrants from Croatia 9th Grade Correlation Chart
The statistical analysis conducted on geographies consisting of 164,277,573 people shows a weak positive correlation between the proportion of Immigrants from Saudi Arabia and percentage of population with at least 9th grade education in the United States with a correlation coefficient (R) of 0.297 and weighted average of 95.6%. Similarly, the statistical analysis conducted on geographies consisting of 132,548,291 people shows a weak positive correlation between the proportion of Immigrants from Croatia and percentage of population with at least 9th grade education in the United States with a correlation coefficient (R) of 0.274 and weighted average of 95.4%, a difference of 0.21%.
9th Grade Correlation Summary
| Measurement | Immigrants from Saudi Arabia | Immigrants from Croatia |
| Minimum | 85.9% | 90.0% |
| Maximum | 100.0% | 100.0% |
| Range | 14.1% | 10.0% |
| Mean | 97.2% | 96.6% |
| Median | 97.4% | 97.0% |
| Interquartile 25% (IQ1) | 96.0% | 95.9% |
| Interquartile 75% (IQ3) | 99.1% | 98.1% |
| Interquartile Range (IQR) | 3.2% | 2.2% |
| Standard Deviation (Sample) | 2.8% | 2.4% |
| Standard Deviation (Population) | 2.7% | 2.4% |
Demographics Similar to Immigrants from Saudi Arabia and Immigrants from Croatia by 9th Grade
In terms of 9th grade, the demographic groups most similar to Immigrants from Saudi Arabia are Immigrants from Germany (95.6%, a difference of 0.010%), Immigrants from Latvia (95.6%, a difference of 0.010%), American (95.6%, a difference of 0.030%), Filipino (95.6%, a difference of 0.040%), and Delaware (95.6%, a difference of 0.040%). Similarly, the demographic groups most similar to Immigrants from Croatia are Cherokee (95.4%, a difference of 0.0%), Chickasaw (95.5%, a difference of 0.030%), Osage (95.5%, a difference of 0.030%), Immigrants from Bulgaria (95.5%, a difference of 0.030%), and Immigrants from Zimbabwe (95.5%, a difference of 0.040%).
| Demographics | Rating | Rank | 9th Grade |
| Immigrants | Saudi Arabia | 98.8 /100 | #92 | Exceptional 95.6% |
| Immigrants | Germany | 98.7 /100 | #93 | Exceptional 95.6% |
| Immigrants | Latvia | 98.7 /100 | #94 | Exceptional 95.6% |
| Americans | 98.5 /100 | #95 | Exceptional 95.6% |
| Filipinos | 98.5 /100 | #96 | Exceptional 95.6% |
| Delaware | 98.4 /100 | #97 | Exceptional 95.6% |
| Immigrants | Japan | 98.4 /100 | #98 | Exceptional 95.6% |
| Menominee | 98.3 /100 | #99 | Exceptional 95.6% |
| Lebanese | 98.1 /100 | #100 | Exceptional 95.6% |
| Immigrants | Moldova | 97.9 /100 | #101 | Exceptional 95.5% |
| Immigrants | Switzerland | 97.7 /100 | #102 | Exceptional 95.5% |
| Potawatomi | 97.7 /100 | #103 | Exceptional 95.5% |
| Syrians | 97.4 /100 | #104 | Exceptional 95.5% |
| Immigrants | France | 97.4 /100 | #105 | Exceptional 95.5% |
| Immigrants | Norway | 97.1 /100 | #106 | Exceptional 95.5% |
| Immigrants | Zimbabwe | 96.9 /100 | #107 | Exceptional 95.5% |
| Chickasaw | 96.8 /100 | #108 | Exceptional 95.5% |
| Osage | 96.8 /100 | #109 | Exceptional 95.5% |
| Immigrants | Bulgaria | 96.7 /100 | #110 | Exceptional 95.5% |
| Cherokee | 96.3 /100 | #111 | Exceptional 95.4% |
| Immigrants | Croatia | 96.2 /100 | #112 | Exceptional 95.4% |