Immigrants from Zimbabwe vs German Professional Degree
COMPARE
Immigrants from Zimbabwe
German
Professional Degree
Professional Degree Comparison
Immigrants from Zimbabwe
Germans
5.3%
PROFESSIONAL DEGREE
99.6/ 100
METRIC RATING
85th/ 347
METRIC RANK
4.1%
PROFESSIONAL DEGREE
11.6/ 100
METRIC RATING
211th/ 347
METRIC RANK
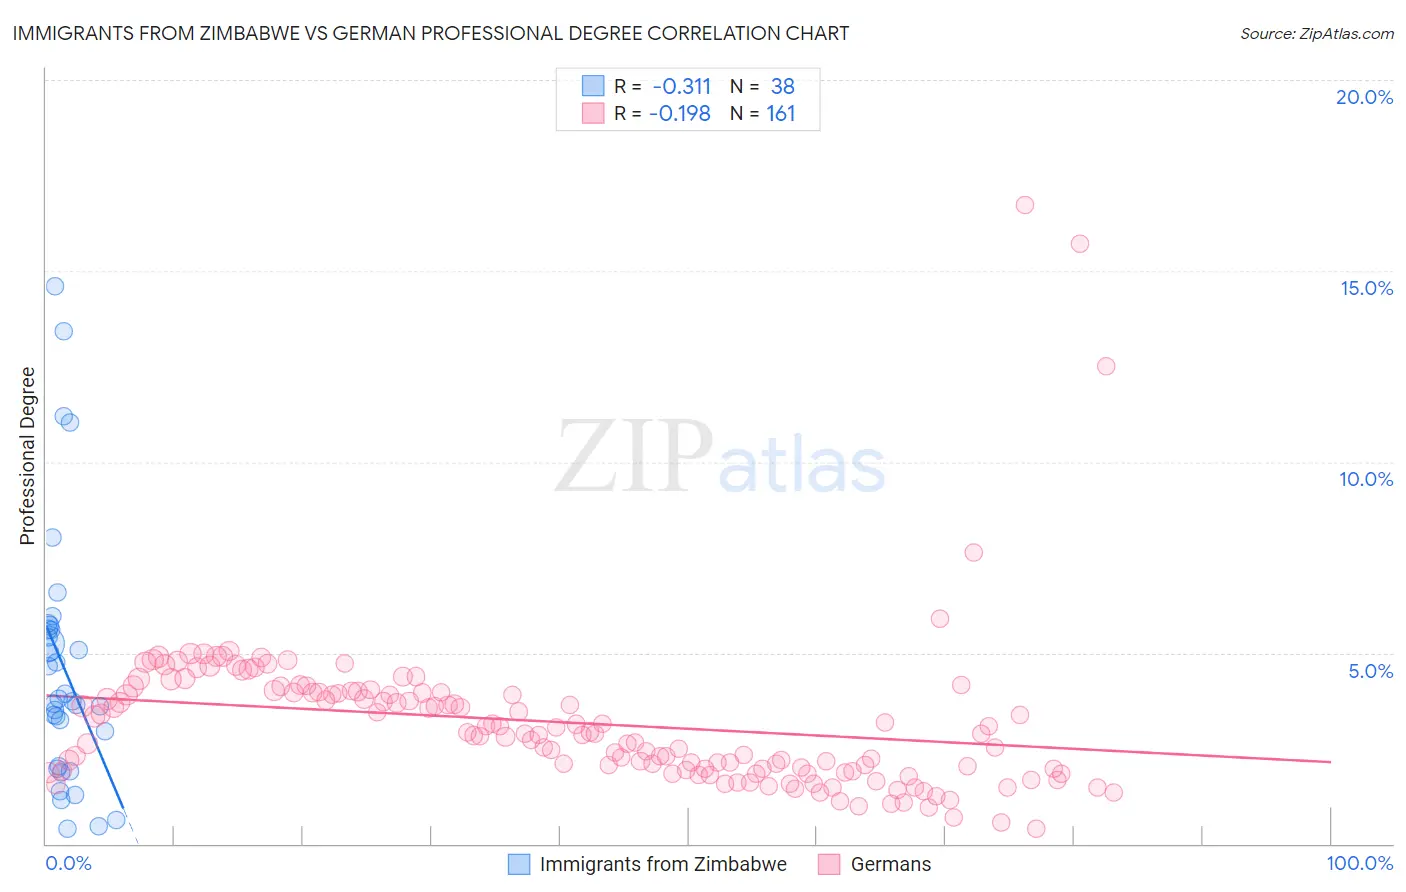
Immigrants from Zimbabwe vs German Professional Degree Correlation Chart
The statistical analysis conducted on geographies consisting of 117,758,651 people shows a mild negative correlation between the proportion of Immigrants from Zimbabwe and percentage of population with at least professional degree education in the United States with a correlation coefficient (R) of -0.311 and weighted average of 5.3%. Similarly, the statistical analysis conducted on geographies consisting of 569,766,622 people shows a poor negative correlation between the proportion of Germans and percentage of population with at least professional degree education in the United States with a correlation coefficient (R) of -0.198 and weighted average of 4.1%, a difference of 29.1%.
Professional Degree Correlation Summary
| Measurement | Immigrants from Zimbabwe | German |
| Minimum | 0.39% | 0.41% |
| Maximum | 14.6% | 16.7% |
| Range | 14.2% | 16.3% |
| Mean | 4.6% | 3.2% |
| Median | 3.8% | 2.9% |
| Interquartile 25% (IQ1) | 2.0% | 1.9% |
| Interquartile 75% (IQ3) | 5.6% | 4.0% |
| Interquartile Range (IQR) | 3.6% | 2.1% |
| Standard Deviation (Sample) | 3.3% | 2.1% |
| Standard Deviation (Population) | 3.3% | 2.1% |
Similar Demographics by Professional Degree
Demographics Similar to Immigrants from Zimbabwe by Professional Degree
In terms of professional degree, the demographic groups most similar to Immigrants from Zimbabwe are Greek (5.3%, a difference of 0.0%), Carpatho Rusyn (5.3%, a difference of 0.020%), Immigrants from Croatia (5.3%, a difference of 0.020%), Immigrants from Chile (5.3%, a difference of 0.11%), and Romanian (5.3%, a difference of 0.22%).
| Demographics | Rating | Rank | Professional Degree |
| Armenians | 99.7 /100 | #78 | Exceptional 5.3% |
| Immigrants | North America | 99.7 /100 | #79 | Exceptional 5.3% |
| Immigrants | England | 99.6 /100 | #80 | Exceptional 5.3% |
| Immigrants | Brazil | 99.6 /100 | #81 | Exceptional 5.3% |
| Romanians | 99.6 /100 | #82 | Exceptional 5.3% |
| Carpatho Rusyns | 99.6 /100 | #83 | Exceptional 5.3% |
| Immigrants | Croatia | 99.6 /100 | #84 | Exceptional 5.3% |
| Immigrants | Zimbabwe | 99.6 /100 | #85 | Exceptional 5.3% |
| Greeks | 99.6 /100 | #86 | Exceptional 5.3% |
| Immigrants | Chile | 99.5 /100 | #87 | Exceptional 5.3% |
| Egyptians | 99.5 /100 | #88 | Exceptional 5.3% |
| Chileans | 99.5 /100 | #89 | Exceptional 5.3% |
| Immigrants | Scotland | 99.5 /100 | #90 | Exceptional 5.3% |
| Laotians | 99.5 /100 | #91 | Exceptional 5.2% |
| Immigrants | Eastern Europe | 99.5 /100 | #92 | Exceptional 5.2% |
Demographics Similar to Germans by Professional Degree
In terms of professional degree, the demographic groups most similar to Germans are Immigrants from Nigeria (4.1%, a difference of 0.030%), White/Caucasian (4.1%, a difference of 0.18%), Immigrants from Panama (4.1%, a difference of 0.26%), Immigrants from Somalia (4.1%, a difference of 0.33%), and Korean (4.1%, a difference of 0.36%).
| Demographics | Rating | Rank | Professional Degree |
| Barbadians | 15.8 /100 | #204 | Poor 4.1% |
| Somalis | 14.8 /100 | #205 | Poor 4.1% |
| Yugoslavians | 13.4 /100 | #206 | Poor 4.1% |
| Sub-Saharan Africans | 12.8 /100 | #207 | Poor 4.1% |
| Immigrants | Somalia | 12.5 /100 | #208 | Poor 4.1% |
| Immigrants | Panama | 12.3 /100 | #209 | Poor 4.1% |
| Immigrants | Nigeria | 11.7 /100 | #210 | Poor 4.1% |
| Germans | 11.6 /100 | #211 | Poor 4.1% |
| Whites/Caucasians | 11.2 /100 | #212 | Poor 4.1% |
| Koreans | 10.7 /100 | #213 | Poor 4.1% |
| Immigrants | Ghana | 10.6 /100 | #214 | Poor 4.1% |
| Portuguese | 10.5 /100 | #215 | Poor 4.1% |
| West Indians | 9.8 /100 | #216 | Tragic 4.1% |
| Immigrants | Vietnam | 9.4 /100 | #217 | Tragic 4.0% |
| Dutch | 9.0 /100 | #218 | Tragic 4.0% |