U.S. Virgin Islander vs Immigrants from Netherlands Professional Degree
COMPARE
U.S. Virgin Islander
Immigrants from Netherlands
Professional Degree
Professional Degree Comparison
U.S. Virgin Islanders
Immigrants from Netherlands
3.7%
PROFESSIONAL DEGREE
1.0/ 100
METRIC RATING
262nd/ 347
METRIC RANK
5.8%
PROFESSIONAL DEGREE
100.0/ 100
METRIC RATING
53rd/ 347
METRIC RANK
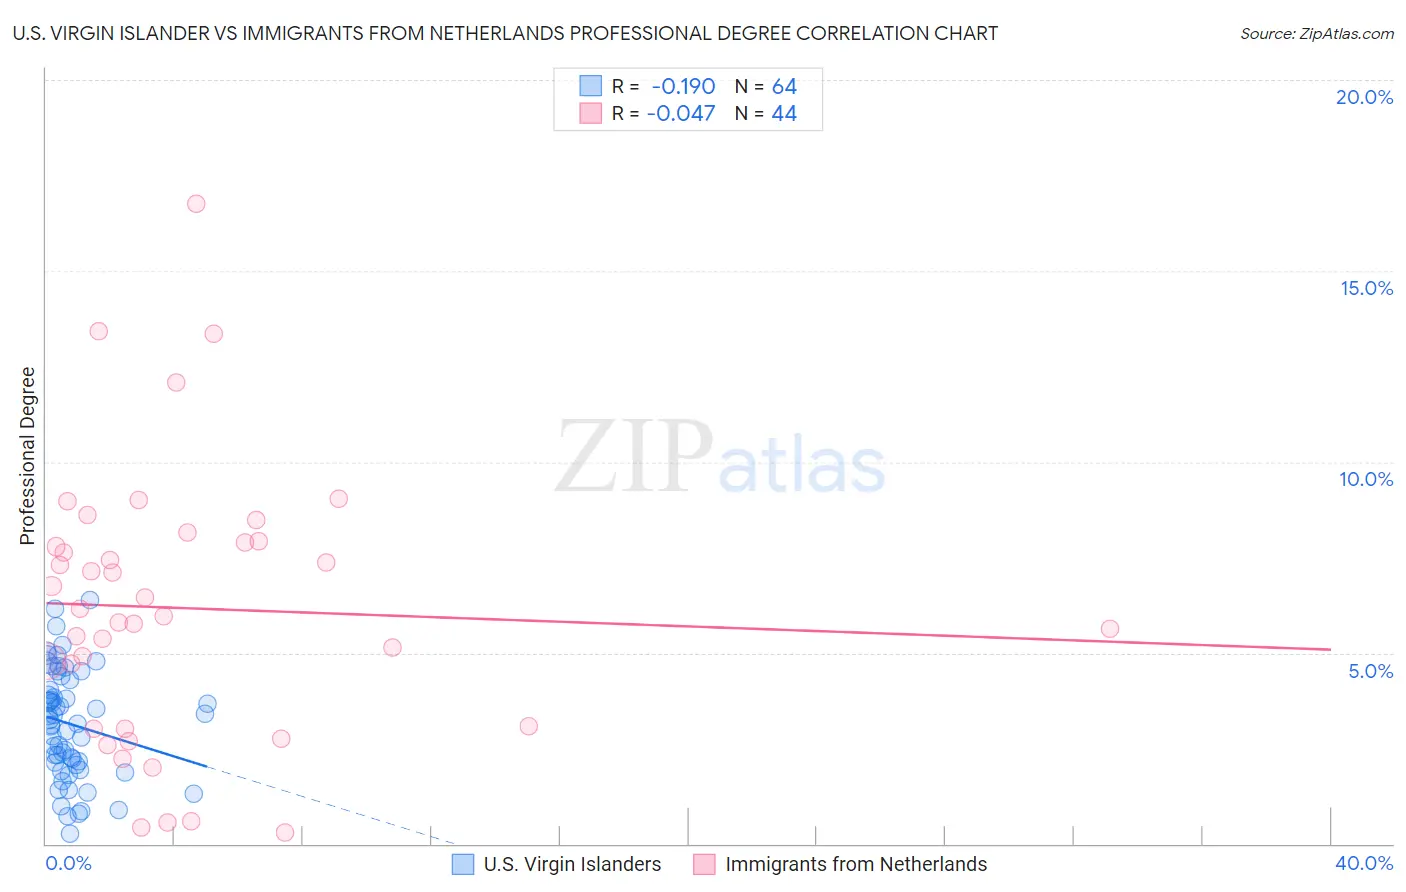
U.S. Virgin Islander vs Immigrants from Netherlands Professional Degree Correlation Chart
The statistical analysis conducted on geographies consisting of 87,432,219 people shows a poor negative correlation between the proportion of U.S. Virgin Islanders and percentage of population with at least professional degree education in the United States with a correlation coefficient (R) of -0.190 and weighted average of 3.7%. Similarly, the statistical analysis conducted on geographies consisting of 237,680,329 people shows no correlation between the proportion of Immigrants from Netherlands and percentage of population with at least professional degree education in the United States with a correlation coefficient (R) of -0.047 and weighted average of 5.8%, a difference of 58.3%.
Professional Degree Correlation Summary
| Measurement | U.S. Virgin Islander | Immigrants from Netherlands |
| Minimum | 0.26% | 0.31% |
| Maximum | 6.4% | 16.8% |
| Range | 6.1% | 16.4% |
| Mean | 3.1% | 6.2% |
| Median | 3.2% | 6.1% |
| Interquartile 25% (IQ1) | 2.1% | 3.1% |
| Interquartile 75% (IQ3) | 4.1% | 7.9% |
| Interquartile Range (IQR) | 2.1% | 4.8% |
| Standard Deviation (Sample) | 1.4% | 3.6% |
| Standard Deviation (Population) | 1.4% | 3.5% |
Similar Demographics by Professional Degree
Demographics Similar to U.S. Virgin Islanders by Professional Degree
In terms of professional degree, the demographic groups most similar to U.S. Virgin Islanders are Immigrants from Guyana (3.7%, a difference of 0.010%), Indonesian (3.7%, a difference of 0.19%), African (3.7%, a difference of 0.20%), Immigrants from St. Vincent and the Grenadines (3.7%, a difference of 0.42%), and Bahamian (3.7%, a difference of 0.50%).
| Demographics | Rating | Rank | Professional Degree |
| Osage | 1.2 /100 | #255 | Tragic 3.7% |
| Iroquois | 1.2 /100 | #256 | Tragic 3.7% |
| Bahamians | 1.1 /100 | #257 | Tragic 3.7% |
| Immigrants | St. Vincent and the Grenadines | 1.1 /100 | #258 | Tragic 3.7% |
| Africans | 1.0 /100 | #259 | Tragic 3.7% |
| Indonesians | 1.0 /100 | #260 | Tragic 3.7% |
| Immigrants | Guyana | 1.0 /100 | #261 | Tragic 3.7% |
| U.S. Virgin Islanders | 1.0 /100 | #262 | Tragic 3.7% |
| Hopi | 0.9 /100 | #263 | Tragic 3.6% |
| Immigrants | Cambodia | 0.9 /100 | #264 | Tragic 3.6% |
| Immigrants | Congo | 0.8 /100 | #265 | Tragic 3.6% |
| Central American Indians | 0.8 /100 | #266 | Tragic 3.6% |
| Delaware | 0.7 /100 | #267 | Tragic 3.6% |
| Aleuts | 0.7 /100 | #268 | Tragic 3.6% |
| Immigrants | Cuba | 0.6 /100 | #269 | Tragic 3.6% |
Demographics Similar to Immigrants from Netherlands by Professional Degree
In terms of professional degree, the demographic groups most similar to Immigrants from Netherlands are Immigrants from Serbia (5.8%, a difference of 0.23%), Immigrants from Greece (5.8%, a difference of 0.30%), Immigrants from Czechoslovakia (5.8%, a difference of 0.36%), Immigrants from Latvia (5.8%, a difference of 0.68%), and Immigrants from Kuwait (5.7%, a difference of 1.0%).
| Demographics | Rating | Rank | Professional Degree |
| Immigrants | Argentina | 100.0 /100 | #46 | Exceptional 5.9% |
| Australians | 100.0 /100 | #47 | Exceptional 5.9% |
| Paraguayans | 100.0 /100 | #48 | Exceptional 5.9% |
| Immigrants | Latvia | 100.0 /100 | #49 | Exceptional 5.8% |
| Immigrants | Czechoslovakia | 100.0 /100 | #50 | Exceptional 5.8% |
| Immigrants | Greece | 100.0 /100 | #51 | Exceptional 5.8% |
| Immigrants | Serbia | 100.0 /100 | #52 | Exceptional 5.8% |
| Immigrants | Netherlands | 100.0 /100 | #53 | Exceptional 5.8% |
| Immigrants | Kuwait | 100.0 /100 | #54 | Exceptional 5.7% |
| Immigrants | Western Europe | 100.0 /100 | #55 | Exceptional 5.7% |
| Immigrants | Malaysia | 100.0 /100 | #56 | Exceptional 5.7% |
| South Africans | 100.0 /100 | #57 | Exceptional 5.7% |
| Bulgarians | 100.0 /100 | #58 | Exceptional 5.7% |
| Immigrants | Europe | 100.0 /100 | #59 | Exceptional 5.6% |
| Bolivians | 99.9 /100 | #60 | Exceptional 5.6% |